Unlock a world of possibilities! Login now and discover the exclusive benefits awaiting you.
- Qlik Community
- :
- All Forums
- :
- QlikView App Dev
- :
- How to make an invisible curve on some of the data...
- Subscribe to RSS Feed
- Mark Topic as New
- Mark Topic as Read
- Float this Topic for Current User
- Bookmark
- Subscribe
- Mute
- Printer Friendly Page
- Mark as New
- Bookmark
- Subscribe
- Mute
- Subscribe to RSS Feed
- Permalink
- Report Inappropriate Content
How to make an invisible curve on some of the data?
Hello,
I started on Qlik View application and want your help please.
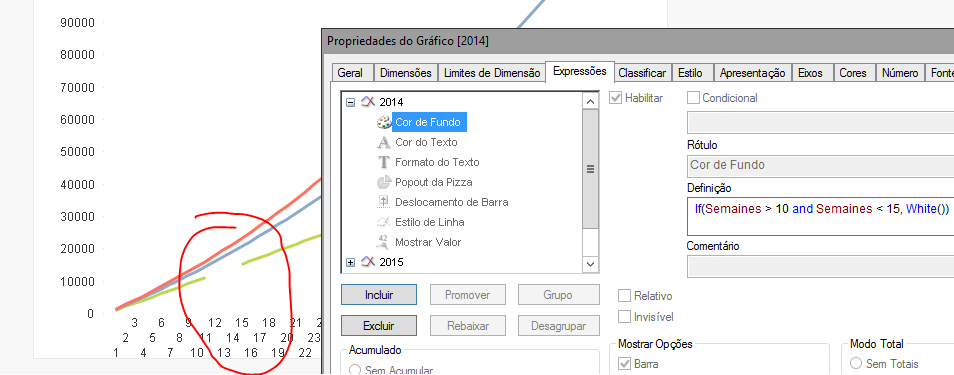
I just created the chart below, by checking each of the years 2014.2015 and 2016 the box "Cumulative total" (in "Chart Properties", "Expressions" tab).
The trouble is that Qlik View shows for the year 2016 values of the week for the entire year as the year is not over (which results in a straight line). cf. ORANGE CURVE BELOW
I wish that the curve is invisible from week 32 to week 52 (or the curve stops at week 31) only for the year 2016 (note, the display of all the values for the years 2014 and 2015 and for me is mandatory).
Can you help me please ? I thank you in advance.

Ce message a été modifié par : Nathalie Ramassamy EXAMPLE
- Mark as New
- Bookmark
- Subscribe
- Mute
- Subscribe to RSS Feed
- Permalink
- Report Inappropriate Content
Set backgroundcolor for the expression for something like
If(WeekField >= 32 and WeekField <= 52, White())
- Mark as New
- Bookmark
- Subscribe
- Mute
- Subscribe to RSS Feed
- Permalink
- Report Inappropriate Content
please post a sample application to demonstrate with
thanks
regards
Marco
- Mark as New
- Bookmark
- Subscribe
- Mute
- Subscribe to RSS Feed
- Permalink
- Report Inappropriate Content
you can make condition in your expression that if date is less than date now show data.
for example
if(weekfeild<=num(Week(Date(now()))),weekfeild)
- Mark as New
- Bookmark
- Subscribe
- Mute
- Subscribe to RSS Feed
- Permalink
- Report Inappropriate Content
Hello and thank you for your answers,
However I tried to apply your advices unsuccessfully.
I added an example in the original message (I did not manage to put it in my reply).
Thanks again for your help !
- Mark as New
- Bookmark
- Subscribe
- Mute
- Subscribe to RSS Feed
- Permalink
- Report Inappropriate Content
- Mark as New
- Bookmark
- Subscribe
- Mute
- Subscribe to RSS Feed
- Permalink
- Report Inappropriate Content
Great, it works! thank you very much !
- Mark as New
- Bookmark
- Subscribe
- Mute
- Subscribe to RSS Feed
- Permalink
- Report Inappropriate Content
Good to read that.
Kindly mark some answer as "Correct" to close the thread