Unlock a world of possibilities! Login now and discover the exclusive benefits awaiting you.
- Qlik Community
- :
- All Forums
- :
- QlikView App Dev
- :
- How to make appear camember graphics which is fonc...
- Subscribe to RSS Feed
- Mark Topic as New
- Mark Topic as Read
- Float this Topic for Current User
- Bookmark
- Subscribe
- Mute
- Printer Friendly Page
- Mark as New
- Bookmark
- Subscribe
- Mute
- Subscribe to RSS Feed
- Permalink
- Report Inappropriate Content
How to make appear camember graphics which is fonction of years
Hello.
I want to make appear in the camenber graphic which is fonction of a number of years.
For exemple:
If i select the years 2002,2003 and 2004
I want to make appear three camenber graphics. One for each years (2002,2003 and 2004) .
Best regards.
LOGBO Destin
- Tags:
- new_to_qlikview
Accepted Solutions
- Mark as New
- Bookmark
- Subscribe
- Mute
- Subscribe to RSS Feed
- Permalink
- Report Inappropriate Content
- Mark as New
- Bookmark
- Subscribe
- Mute
- Subscribe to RSS Feed
- Permalink
- Report Inappropriate Content
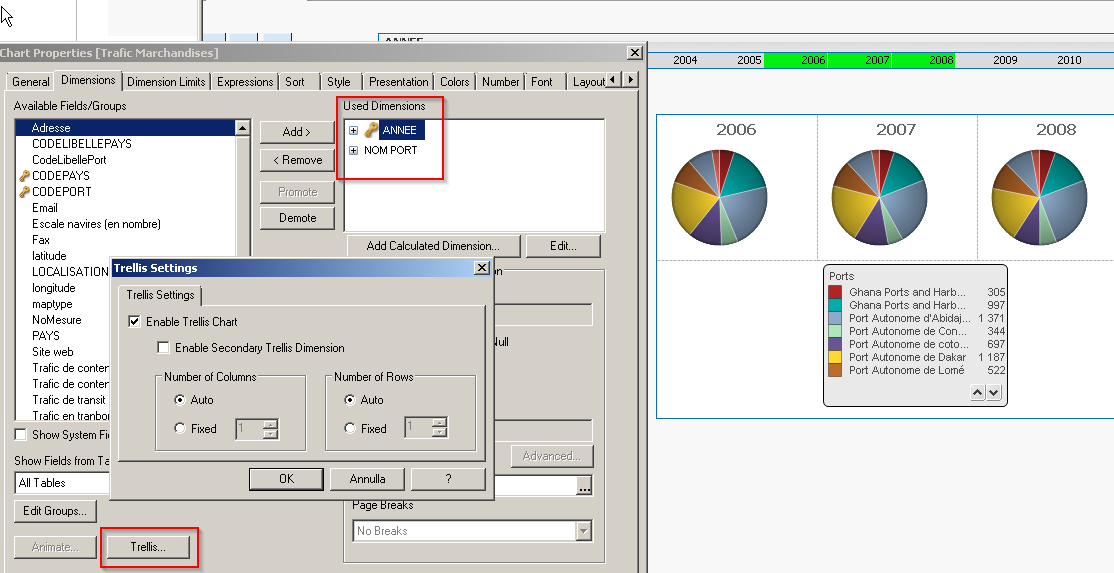
Try using Trellis option on Dimension page of chart properties, it splits the chart into several charts by the values of first dimension (it would be Year in your example).
- Mark as New
- Bookmark
- Subscribe
- Mute
- Subscribe to RSS Feed
- Permalink
- Report Inappropriate Content
add ANNEE as first dimension and enable trellis as Jakub suggests
- Mark as New
- Bookmark
- Subscribe
- Mute
- Subscribe to RSS Feed
- Permalink
- Report Inappropriate Content
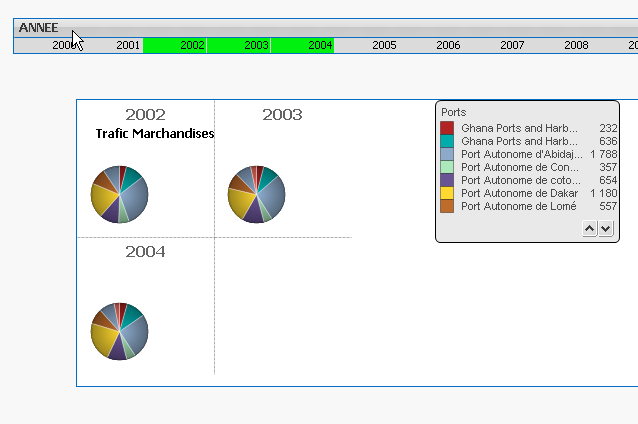
If i select the years 2002,2003 and 2004
I want to make appear three (3) camenber graphics with only one dimension, the Ports. One for each years (2002,2003 and 2004).
When i add 2 dimension (Ports and ANNEE) i have only one graphic. I want 3 graphics. One for 2002, one for 2003 and one for 2004.
Best Regard's
- Mark as New
- Bookmark
- Subscribe
- Mute
- Subscribe to RSS Feed
- Permalink
- Report Inappropriate Content
I thought you wanted this
- Mark as New
- Bookmark
- Subscribe
- Mute
- Subscribe to RSS Feed
- Permalink
- Report Inappropriate Content
Yes, Massimo Grossi, this is what I want.
How do you do it?
- Mark as New
- Bookmark
- Subscribe
- Mute
- Subscribe to RSS Feed
- Permalink
- Report Inappropriate Content
- Mark as New
- Bookmark
- Subscribe
- Mute
- Subscribe to RSS Feed
- Permalink
- Report Inappropriate Content
Thank you Massimo GrossI
It work.
Best regard's
- Mark as New
- Bookmark
- Subscribe
- Mute
- Subscribe to RSS Feed
- Permalink
- Report Inappropriate Content
Please close this discussion by giving Correct and Helpful answers to the posts (Jakub Michalik gave the answer) which are useful for you. It helps others in finding answers for similar scenarios. Thanks and good Qlik.