Unlock a world of possibilities! Login now and discover the exclusive benefits awaiting you.
- Qlik Community
- :
- All Forums
- :
- QlikView App Dev
- :
- How to make the forecast line dotted?
- Subscribe to RSS Feed
- Mark Topic as New
- Mark Topic as Read
- Float this Topic for Current User
- Bookmark
- Subscribe
- Mute
- Printer Friendly Page
- Mark as New
- Bookmark
- Subscribe
- Mute
- Subscribe to RSS Feed
- Permalink
- Report Inappropriate Content
How to make the forecast line dotted?
I am trying build a Sales vs Year Line chart where I want to show the Sales line continued after the current year as dotted forecast line. I tried the forecast option under 'Axes' but it gives me a separate line and not in continuation with the existing line. Also, I want the forecast line to be dotted. Please help
Thanks
Abhishek
- « Previous Replies
-
- 1
- 2
- Next Replies »
- Mark as New
- Bookmark
- Subscribe
- Mute
- Subscribe to RSS Feed
- Permalink
- Report Inappropriate Content
Can you share your sample data?
- Mark as New
- Bookmark
- Subscribe
- Mute
- Subscribe to RSS Feed
- Permalink
- Report Inappropriate Content
Try using the line style option for the expression .
Better post a sample
- Mark as New
- Bookmark
- Subscribe
- Mute
- Subscribe to RSS Feed
- Permalink
- Report Inappropriate Content
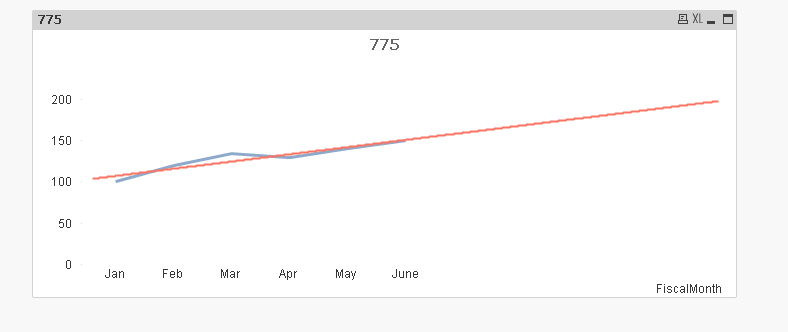
Sorry I cant post the actual data. Here is a sample data and the chart what I got. I want the red trend line to start from July and be in dotted format.
MarketShare:
Load * Inline
[
FiscalMonth, Value
Jan,100
Feb,120
Mar,135
Apr,130
May,140
June,150
Jul, 0
Aug,0
Sep,0
Oct,0
Nov,0
Dec,0
];
- Mark as New
- Bookmark
- Subscribe
- Mute
- Subscribe to RSS Feed
- Permalink
- Report Inappropriate Content
It is areference line or trnd line let me know please.
- Mark as New
- Bookmark
- Subscribe
- Mute
- Subscribe to RSS Feed
- Permalink
- Report Inappropriate Content
Blue line is from expression : Sum(Value)
and red line is the trend line. I want red line to start from July and show as dotted as per the forecast option used.
- Mark as New
- Bookmark
- Subscribe
- Mute
- Subscribe to RSS Feed
- Permalink
- Report Inappropriate Content
Line Style option is not available for the Trend Line.
- Mark as New
- Bookmark
- Subscribe
- Mute
- Subscribe to RSS Feed
- Permalink
- Report Inappropriate Content
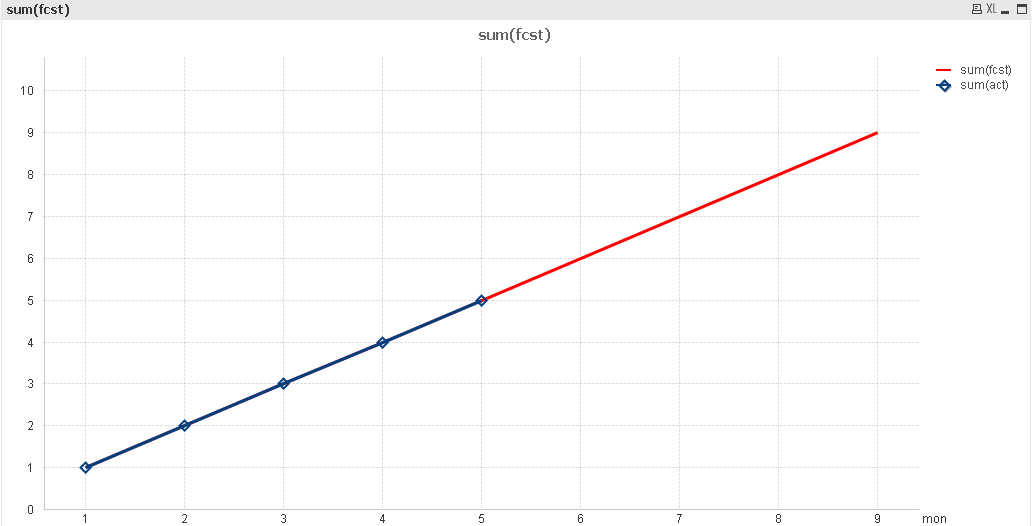
I am not sure that you can do that. I think having a similar set of lines to those that you have outlined may be the best solution. You may think about changing the colour of the forecast line when it is just a forecast and putting symbols on the actual line to differentiate.
- Mark as New
- Bookmark
- Subscribe
- Mute
- Subscribe to RSS Feed
- Permalink
- Report Inappropriate Content
I should have said that in situations such as this I usually force the values for the forecast in the months prior to "today" to be the same value as the actual so that overlaying is relatievly simpe. The only item to watch out for is the order of your lines as the actual must be painted after the forecast line.
- Mark as New
- Bookmark
- Subscribe
- Mute
- Subscribe to RSS Feed
- Permalink
- Report Inappropriate Content
You are wright on your part.
But I did not want to provide the forecast data from the source and allow Qlikview to forecast values based on the Trend Lines and Forecast options available to get the dotted lines. I hope QV provides this Line Style functionality for Trend Lines also in upcoming versions.
- « Previous Replies
-
- 1
- 2
- Next Replies »