Unlock a world of possibilities! Login now and discover the exclusive benefits awaiting you.
- Qlik Community
- :
- All Forums
- :
- QlikView App Dev
- :
- How to pivot and then perform set analysis on mont...
- Subscribe to RSS Feed
- Mark Topic as New
- Mark Topic as Read
- Float this Topic for Current User
- Bookmark
- Subscribe
- Mute
- Printer Friendly Page
- Mark as New
- Bookmark
- Subscribe
- Mute
- Subscribe to RSS Feed
- Permalink
- Report Inappropriate Content
How to pivot and then perform set analysis on month
I really can't figure out how to go about one issue I am having.
I have a data set with something similar to the following data.
- Date (MM/DD/YYYY)
- DateMonthKey (A key a made myself, it takes the date and the month and makes a key)
- CategoryType (Interest, Reversal)
- Balance
I then have a table with dates:
- Date (MM/DD/YYYY)
- Month (MMM YYYY)
- Year (YYYY)
- DateMonthKey (Same as above)
I have a link table that drops the DateMonth key from the first data set and puts it into a link table. I am doing this because of synthetic key and other joining issues with other non-related datasets.
I have made a chart that's a pivot table, The chart has the following dimensions:
- Month
- Category Type
There are 2 main types of Categories, Interest and Reversal. For example we will just use 2 types here. Type1Interest, Type1Reversal, Type2Interest, Type2Reversal. I have 2 expressions for these that calculates Interest and Reversal:
Interest:
sum({$< [CategoryType] = {'Type1Interest', 'Type2Interest'}>} [Balance])
Reversal:
sum({$< [CategoryType] = {'Type1Reversal', 'Type2Reversal'}>} [Balance])
This works out sort of how I want to have it setup. My first issue is with dates. Interest shows up in the current month. So July's interest will show up in July. However, the reversal values show up the next month. For my chart I would see something like this:
Month - Category Type - Interest - Reversal:
May 2015 - Type1Interest - $700 - $0
- Type1Reversal - $0 - $300
- Type2Interest - $800 - $0
- Type2Reversal - $0 - $200
June 2015 - Type1Interest - $1000 - $0
- Type1Reversal - $0 - $700
- Type2Interest - $2000 - $400
- Type2Reversal - $0 - $800
July 2015 - Type1Interest - $1100 - $0
- Type1Reversal - $0 - $1000
- Type2Interest - $2100 - $0
- Type2Reersal - $0 - $2000
All of this data is historical data. Not current month. So the interest/reversal already happened. So look at June. I have a Type1Interest value of $1000. The Type1Reversal value that should match this month is actually dated in july. So the reversal value shows up in July. You can also see the same situation from may - june. The May interest value is showing up in the June reversal.
First question:
- How can I get the Type1Interest to continue to look at the current month, but get the Type1Reversal to grab the value from the next month? I would expect in my June value to see Type1Interest = $1000 and Type1Reversal = $1000 (which is in july currently). Is there any set analysis or expression magic I can do to tell it to look at the next month?
Second question:
- What would be the best way to pivot these? Here would be a great example of a final chart:
Month - Type1Interest - Type1Reversal - Type2Interest - Type2Reversal
May 2015 - $700 - $700 - $800 - $800
June 2015 - $1000 - $1000 - $2000 - $2000
July 2015 - $1100 - $1100 - $2100 - 2100
I know this is pretty much a pivot but I figured I would call this out if it would mess up the set analysis.
I am really lost on how to go about doing this. Any help would be greatly appreciated.
- Tags:
- pivot
- set analysis
Accepted Solutions
- Mark as New
- Bookmark
- Subscribe
- Mute
- Subscribe to RSS Feed
- Permalink
- Report Inappropriate Content
Hi Tom
Indeed it will with slight adjustment to the set analysis, as you have already concatenated the data.
If I have understood correctly your data looks like this:
So in essence you have already concatenated your four sets of data i.e. the four categories
- Type1Interest
- Type1Reversal
- Type2Interest
- Type2Reversal
and you have a dimension that is common to all four i.e. MonthYear
The result you want to achieve is this:
The new formulas to achieve this are:
Type 1 Interest: Sum ({$<Category={'Type1Interest'}>}Balance)
Type 1 Reversal:
If(
Len(below(Sum ({$<Category={'Type1Reversal'}>}Balance)))<1,
Sum ({$<Category={'Type1Interest'}>}Balance)
,
below(Sum ({$<Category={'Type1Reversal'}>}Balance))
)
Type 2 Interest: Sum ({$<Category={'Type2Interest'}>}Balance)
Type 2 Reversal:
If(
Len(below(Sum ({$<Category={'Type2Reversal'}>}Balance)))<1,
Sum ({$<Category={'Type2Interest'}>}Balance)
,
below(Sum ({$<Category={'Type2Reversal'}>}Balance))
)
Again I used MonthYear as the dimension based on: =Date(Date,'MMM-YYYY')
Hope that helps.
Kind regards
Steve
- Mark as New
- Bookmark
- Subscribe
- Mute
- Subscribe to RSS Feed
- Permalink
- Report Inappropriate Content
Hi Tom
If I have understood correctly I believe you have three sets of data
- Your 'MonthYear' values which you call Month (MMM YYYY)
- Your Interest data
- Your Reversal data
This means you have one dimension table and two data tables, a scenario which lends itself very well to using concatenation of the data tables to remove synthetic keys.
I arrived at this table which is what I think you are trying to achieve:

To do this I followed the steps below:
Load the calendar data to get your MonthYear values. This is your dimension table and will link to both the interest and reversal data
Load the interest data. I have used an inline load and the first of the month just for simplicity but your date values can be formatted as MMM-YYYY using e.g. Date(MonthStart(YourDateField),'MMM-YYYY') to get the MonthYear
Interest:
Load * inline [
Date,Type1,Type2,Category
01/05/2015,700,800,Interest
01/06/2015,1000,2000,Interest
01/07/2015,1100,2100,Interest
] ;
As you will see I have structured this data so that there are four fields, the Date field, a Type1 field, a Type 2 field and a category field. Thus I have tagged this data as 'Interest'
Load the reversal data. Again I have used an inline load for simplicity and have tagged the data as 'Reversal'
Reversal:
concatenate (Interest)
Load * inline [
Date,Type1,Type2,Category
01/05/2015,300,200,Reversal
01/06/2015,700,800,Reversal
01/07/2015,1000,2000,Reversal
] ;
You will notice that the fields names in the Reversal table are the same as the field names in the Interest table. This means that the interest and reversal data will automatically concatenate to form one data table. I have used the concatenate (Interest) line just for clarity but you actually do not need this if the field names are identical in the interest and reversal tables.
Once loaded this means you will have a data table in memory that looks like this:

Create a straight table. You can now use set analysis in a straight table to pick out your data and organise it in the table.
The dimension would be =Date(Date,'MMM-YYYY')
Then you would need four expressions
1: Type 1 Interest: Sum ({$<Category={'Interest'}>}Type1)
2: Type 1 Reversal:
If(
Len(below(Sum ({$<Category={'Reversal'}>}Type1)))<1,
Sum ({$<Category={'Interest'}>}Type1) ,
below(Sum ({$<Category={'Reversal'}>}Type1))
)
3: Type 2 Interest: Sum ({$<Category={'Interest'}>}Type2)
4: Type 2 Reversal:
If(
Len(below(Sum ({$<Category={'Reversal'}>}Type2)))<1,
Sum ({$<Category={'Interest'}>}Type2)
,
below(Sum ({$<Category={'Reversal'}>}Type2))
)
The reversal formulas use the 'below' function to effectively 'shift' the data up a row in the table so your monthyears will need to be in the correct order for this to work. One issue is with the final month. In your sample you have used the July interest figures as the reversal figures. This is what the 'IF' statement replicates in the reversal formulas. If the 'IF' statement wasn't present you would get a null value in the July reversal fields as there is no August value to shift up.
e.g.
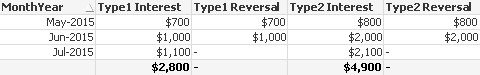
Using the IF statement thus populates the cells with the Interest values creating the table that you want to achieve.

I hope that helps.
Kind regards
Steve
- Mark as New
- Bookmark
- Subscribe
- Mute
- Subscribe to RSS Feed
- Permalink
- Report Inappropriate Content
One issue, the way my table is setup is different. You thought my table looked like:
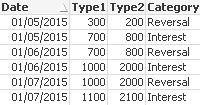
However my data looks like
Date - Category - Balance
01/05/2015 - Type1Interest - 700
01/05/2015 - Type1Reversal - 300
01/05/2015 - Type2Interest - 800
01/05/2015 - Type2Reversal - 200
etc...
Would your logic still apply the same way?
- Mark as New
- Bookmark
- Subscribe
- Mute
- Subscribe to RSS Feed
- Permalink
- Report Inappropriate Content
Hi Tom
Indeed it will with slight adjustment to the set analysis, as you have already concatenated the data.
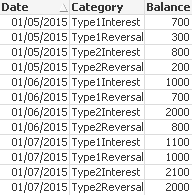
If I have understood correctly your data looks like this:
So in essence you have already concatenated your four sets of data i.e. the four categories
- Type1Interest
- Type1Reversal
- Type2Interest
- Type2Reversal
and you have a dimension that is common to all four i.e. MonthYear
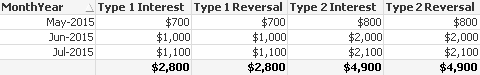
The result you want to achieve is this:
The new formulas to achieve this are:
Type 1 Interest: Sum ({$<Category={'Type1Interest'}>}Balance)
Type 1 Reversal:
If(
Len(below(Sum ({$<Category={'Type1Reversal'}>}Balance)))<1,
Sum ({$<Category={'Type1Interest'}>}Balance)
,
below(Sum ({$<Category={'Type1Reversal'}>}Balance))
)
Type 2 Interest: Sum ({$<Category={'Type2Interest'}>}Balance)
Type 2 Reversal:
If(
Len(below(Sum ({$<Category={'Type2Reversal'}>}Balance)))<1,
Sum ({$<Category={'Type2Interest'}>}Balance)
,
below(Sum ({$<Category={'Type2Reversal'}>}Balance))
)
Again I used MonthYear as the dimension based on: =Date(Date,'MMM-YYYY')
Hope that helps.
Kind regards
Steve