Unlock a world of possibilities! Login now and discover the exclusive benefits awaiting you.
- Qlik Community
- :
- All Forums
- :
- QlikView App Dev
- :
- How to plot this table
- Subscribe to RSS Feed
- Mark Topic as New
- Mark Topic as Read
- Float this Topic for Current User
- Bookmark
- Subscribe
- Mute
- Printer Friendly Page
- Mark as New
- Bookmark
- Subscribe
- Mute
- Subscribe to RSS Feed
- Permalink
- Report Inappropriate Content
How to plot this table
Hi,
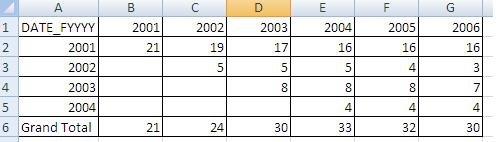
I have this unique requirement where I display the year in row and column and the policy count within the cells with certain logic. I have attached the sample data and the logic to calculate it along with the qlikview document, I want to achieve the same result through qlikview. I tried with before, after, first etc but didn't get the desired results.
Basically the data represents count of policy that were issued in the respective year and how many of them remained active in the subsequent years.
For eg. row 1 shows 21 policies issued in 2001 out of which 19 remained active in 2002 etc.
Thanks in advance,
Lax
- Mark as New
- Bookmark
- Subscribe
- Mute
- Subscribe to RSS Feed
- Permalink
- Report Inappropriate Content
Hi, Is it possible through qlikview with the given data model. Can the experts check it out ?
Thanks,
Lax