Unlock a world of possibilities! Login now and discover the exclusive benefits awaiting you.
- Qlik Community
- :
- All Forums
- :
- QlikView App Dev
- :
- How to recalculate expression based on individual ...
- Subscribe to RSS Feed
- Mark Topic as New
- Mark Topic as Read
- Float this Topic for Current User
- Bookmark
- Subscribe
- Mute
- Printer Friendly Page
- Mark as New
- Bookmark
- Subscribe
- Mute
- Subscribe to RSS Feed
- Permalink
- Report Inappropriate Content
How to recalculate expression based on individual values in a table that displays sum
I have a problem where I want to show the "Price Index" in a row of a table for a dimension that shows sums for other expressions.
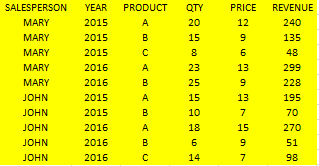
I have a data source like this:
I would like to create a report basically like this - but I cannot figure out how to complete the last column, 'Price Index'
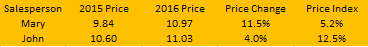
In excel I can demonstrate how the Price Index is calculated. It is basically a weighted average of the price increases, with the weighting being the 2016 revenue. The entire set of data gives a price index of 11.6%, the Price Index for each salesperson is shown above in the sample report: 5.2% and 12.5%
However the rows in the report are sum functions, with the sum of quantity and sum of revenue (both hidden) and divided by each other to get a price for both 2015 and 2016. The price index requires discrete values to be compared to each other and then added together etc to finally get the result. How can something like this be put into a report column?
Below is a how the price index is calculated:
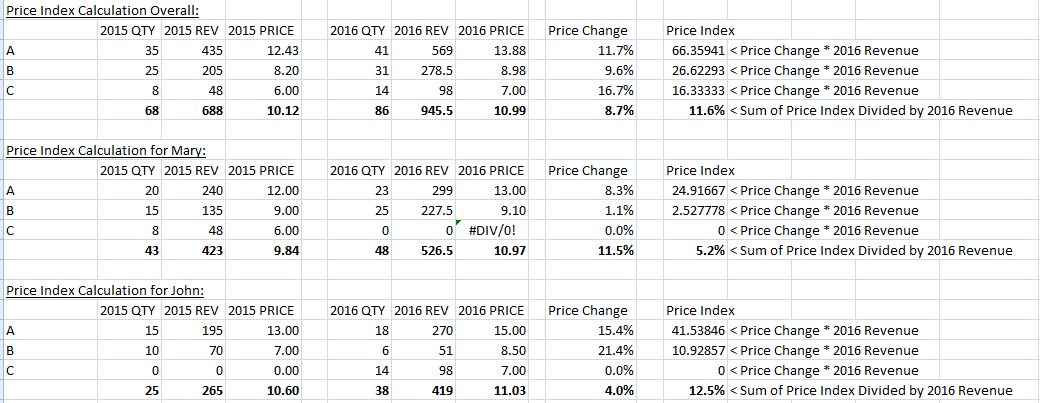
Is this possible?
Thank you
- « Previous Replies
-
- 1
- 2
- Next Replies »
- Mark as New
- Bookmark
- Subscribe
- Mute
- Subscribe to RSS Feed
- Permalink
- Report Inappropriate Content
Hi, I will try this again but with my actual data because I can't go from the sample to the real with it still working...
Here is my rationale with my current understanding of these functions.
(let me know if i should start a new thread for this)
I have a straight table that groups by dimension Customer_Major_code
weight is an expression:
=sum(aggr(if(sum({$<year={$(=max(year-1))},Month=>}Revenue_Total)>0,
if(sum({$<year={$(=max(year))},Month=>}Revenue_Total)>0,
if(sum({$<year={$(=max(year))},Month=>}Volume)>0,
if(sum({$<year={$(=max(year-1))},Month=>}Volume)>0,
sum(Revenue_Total))))),Customer_Major_code,PlantItemEndUse))
so for each Customer_Major_code, weight is the Revenue_Total for each additional dimension PlantItemEndUse within the Customer_Major_code based on the aggr function that seeks to only consider PlantItemEndUse when it has a positive value for Volume and Revenue_Total for current and previous year.
This works
I need another expression that will be the sum of the individual dimensions in the aggr expression - PlantItemEndUse using the same rules/criteria.
so for example, if a particular Customer_Major_code, lets call it "DIY" has within it 10 different PlantItemEndUse values, i want to go through each of those 10 rows of PlantItemEndUse rows, and if both current year (Revenue_Total/Volume)>0 and previous year (Revenue_Total/Volume)>0 then calculate the percentage change for that PlantItemEndUse and multiply it by the Revenue_Total for the current year. When the 10 instances of these are added up i get a total that is finally divided by the expression weight shown above.
- « Previous Replies
-
- 1
- 2
- Next Replies »