Unlock a world of possibilities! Login now and discover the exclusive benefits awaiting you.
- Qlik Community
- :
- All Forums
- :
- QlikView App Dev
- :
- How to remove null valued dimension in a bar chart...
- Subscribe to RSS Feed
- Mark Topic as New
- Mark Topic as Read
- Float this Topic for Current User
- Bookmark
- Subscribe
- Mute
- Printer Friendly Page
- Mark as New
- Bookmark
- Subscribe
- Mute
- Subscribe to RSS Feed
- Permalink
- Report Inappropriate Content
How to remove null valued dimension in a bar chart ?
Hi Techies,
In a bar chart I have Month_Yr as first dimension and Client as second dimension. Also I have 3 expressions.
For Example:
I have 5 clients as A, B, C, D, E.
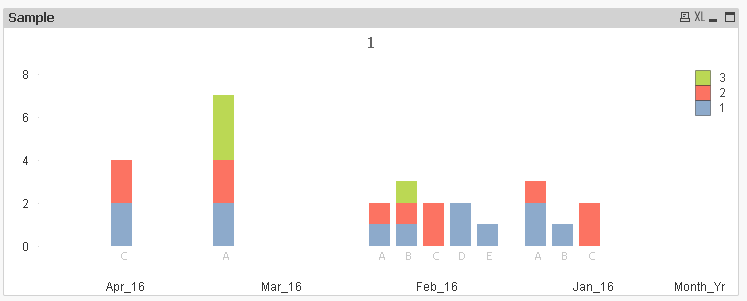
In the Month_Yr : Apr_16 , we have only C as client. But in bar chart for Apr_16 it displays all the clients. Here I want to show only C for Apr_16.
Likewise across all Month_Yr only available clients should come !...
How to achieve this.
Regards,
Rangaraju.
- « Previous Replies
-
- 1
- 2
- Next Replies »
- Mark as New
- Bookmark
- Subscribe
- Mute
- Subscribe to RSS Feed
- Permalink
- Report Inappropriate Content
Hi Rangaraju,
As per my understanding, Axis text is showing properly in the middle only, But in Mar_16 dont have values for clients B,C,D,E thats why it looks that.
In Feb_16 we have all the values thats where u can see axis values in the middle.
- Mark as New
- Bookmark
- Subscribe
- Mute
- Subscribe to RSS Feed
- Permalink
- Report Inappropriate Content
That is strange. I have just downloaded the same app i sent you earlier. It is displaying this
are you doing any changes in axes or presentation tab ?
- Mark as New
- Bookmark
- Subscribe
- Mute
- Subscribe to RSS Feed
- Permalink
- Report Inappropriate Content
No, I did not change anything. Will it be due to different versions??? I am using QlikView 11.20 SR5.
- Mark as New
- Bookmark
- Subscribe
- Mute
- Subscribe to RSS Feed
- Permalink
- Report Inappropriate Content
Could be possible, i am not pretty sure if it is with the version. Mine is QV11.20 SR12.
- « Previous Replies
-
- 1
- 2
- Next Replies »