Unlock a world of possibilities! Login now and discover the exclusive benefits awaiting you.
Announcements
Save $650 on Qlik Connect, Dec 1 - 7, our lowest price of the year. Register with code CYBERWEEK: Register
- Qlik Community
- :
- All Forums
- :
- QlikView App Dev
- :
- How to shade colors above and below Standard Devia...
Options
- Subscribe to RSS Feed
- Mark Topic as New
- Mark Topic as Read
- Float this Topic for Current User
- Bookmark
- Subscribe
- Mute
- Printer Friendly Page
Turn on suggestions
Auto-suggest helps you quickly narrow down your search results by suggesting possible matches as you type.
Showing results for
Not applicable
2017-05-24
10:54 AM
- Mark as New
- Bookmark
- Subscribe
- Mute
- Subscribe to RSS Feed
- Permalink
- Report Inappropriate Content
How to shade colors above and below Standard Deviation(line) in a line chart
Hi Qlik Folks,
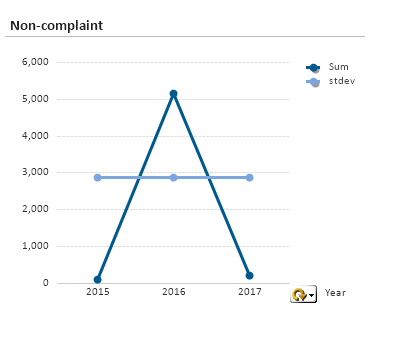
I created the line chart with measures Sum and Standard Deviation(Stdev) as shown below.
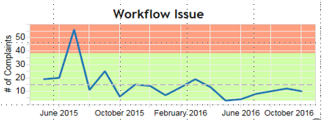
But the requirement is to show the background of the chart above Stdev line with Red color and below to that in Yellow Color (as shown below) where the line at which Red color starts symbolizes Stdev.
I tried multiple options such as choosing 4th chart in Style option and changing background colors to above colors. But nothing has produced desired results.
Note: Please ignore the chart dimension as user wants to see Cyclic group with Time dimension.
Could you please help me with this.
Thank you in advance.
-Laxman
517 Views
0 Replies