Unlock a world of possibilities! Login now and discover the exclusive benefits awaiting you.
- Qlik Community
- :
- All Forums
- :
- QlikView App Dev
- :
- How to show 6 months data using the set analysis i...
Options
- Subscribe to RSS Feed
- Mark Topic as New
- Mark Topic as Read
- Float this Topic for Current User
- Bookmark
- Subscribe
- Mute
- Printer Friendly Page
Turn on suggestions
Auto-suggest helps you quickly narrow down your search results by suggesting possible matches as you type.
Showing results for
Creator III
2018-01-09
11:55 AM
- Mark as New
- Bookmark
- Subscribe
- Mute
- Subscribe to RSS Feed
- Permalink
- Report Inappropriate Content
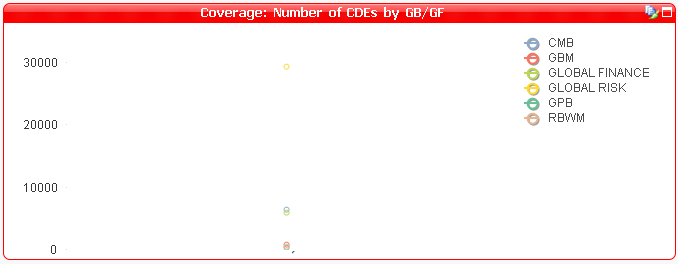
How to show 6 months data using the set analysis in the dimension
Hi All,
I am trying to create line chart. Two dimensions and one expression.
Dimensions:
Date and GB/GF
Expression
Count(Rule Name)
This is working fine.
Now I am trying to show only 6 months of data out of all dates available. I am using below expression in the dimension to display 6 months data but I am not seeing the dates. Can someone please help?
=Aggr(Only({<Date = {'>= $(=vPrevious5MonthYear) <= $(=vCurMonthYear)'}>}Date),Date)
Below is the graph. I don't see Dates.
Cheers,
Varun
- Tags:
- sunny talwar
1,366 Views
- « Previous Replies
-
- 1
- 2
- Next Replies »
10 Replies
Creator III
2018-01-09
01:24 PM
- Mark as New
- Bookmark
- Subscribe
- Mute
- Subscribe to RSS Feed
- Permalink
- Report Inappropriate Content
Ok, but Date comes as JAN 2018 or 9/01/2018. Makes sense that you want to convert it, but maybe is not the proper format.
144 Views
- « Previous Replies
-
- 1
- 2
- Next Replies »