Unlock a world of possibilities! Login now and discover the exclusive benefits awaiting you.
- Qlik Community
- :
- All Forums
- :
- QlikView App Dev
- :
- How to show a expression as a bar and the rest as ...
- Subscribe to RSS Feed
- Mark Topic as New
- Mark Topic as Read
- Float this Topic for Current User
- Bookmark
- Subscribe
- Mute
- Printer Friendly Page
- Mark as New
- Bookmark
- Subscribe
- Mute
- Subscribe to RSS Feed
- Permalink
- Report Inappropriate Content
How to show a expression as a bar and the rest as dots
Hi,
I saw this interesting chart in a qview presentation.
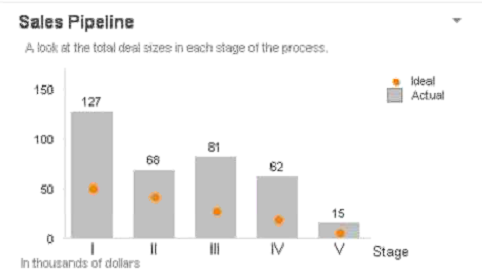
I have three fields (Year , Buget ans LastYear) and I would like to present Year like 'Actual' in the sample that is as a bar, and the other dimensions as dots like 'Ideal'.
How is it possible to present expressions like this?
Thanks.
Accepted Solutions
- Mark as New
- Bookmark
- Subscribe
- Mute
- Subscribe to RSS Feed
- Permalink
- Report Inappropriate Content
Us a combi chart with only Stage (or whatever dimension you want on the x-axis) as dimension. Add three expressions:
Actual: sum(Year)
Budget: sum(Budget)
LastYear: sum(LastYear)
Choose Bar as display type for the Actual expression and for the two others choose Symbol. You can then select Dots as the symbol type. You can increas the symbol size on the Presentation tab if nessary.
talk is cheap, supply exceeds demand