Unlock a world of possibilities! Login now and discover the exclusive benefits awaiting you.
- Qlik Community
- :
- All Forums
- :
- QlikView App Dev
- :
- How to show a value in a line that comes from a di...
- Subscribe to RSS Feed
- Mark Topic as New
- Mark Topic as Read
- Float this Topic for Current User
- Bookmark
- Subscribe
- Mute
- Printer Friendly Page
- Mark as New
- Bookmark
- Subscribe
- Mute
- Subscribe to RSS Feed
- Permalink
- Report Inappropriate Content
How to show a value in a line that comes from a different expression
Hi everybody, I have a line Chart which shows the amount of customer debt every Year&Month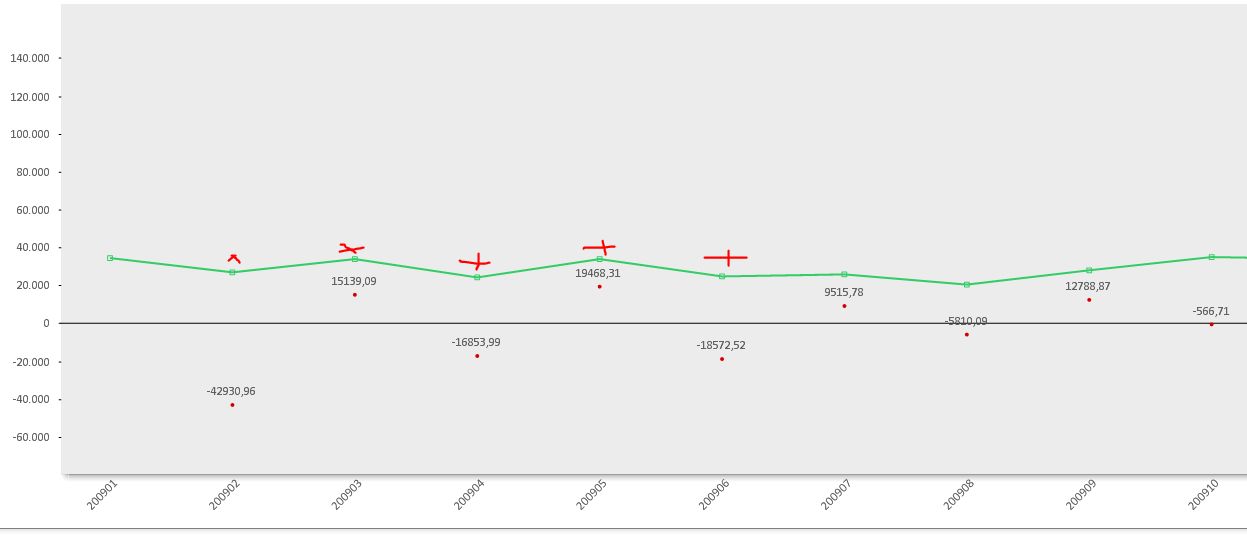
The green line is the the customer Debt and the red dots with numbers come from another expression which displays the difference of the debt between the previous and the current month. This expression is:
Debt-Above(Debt)
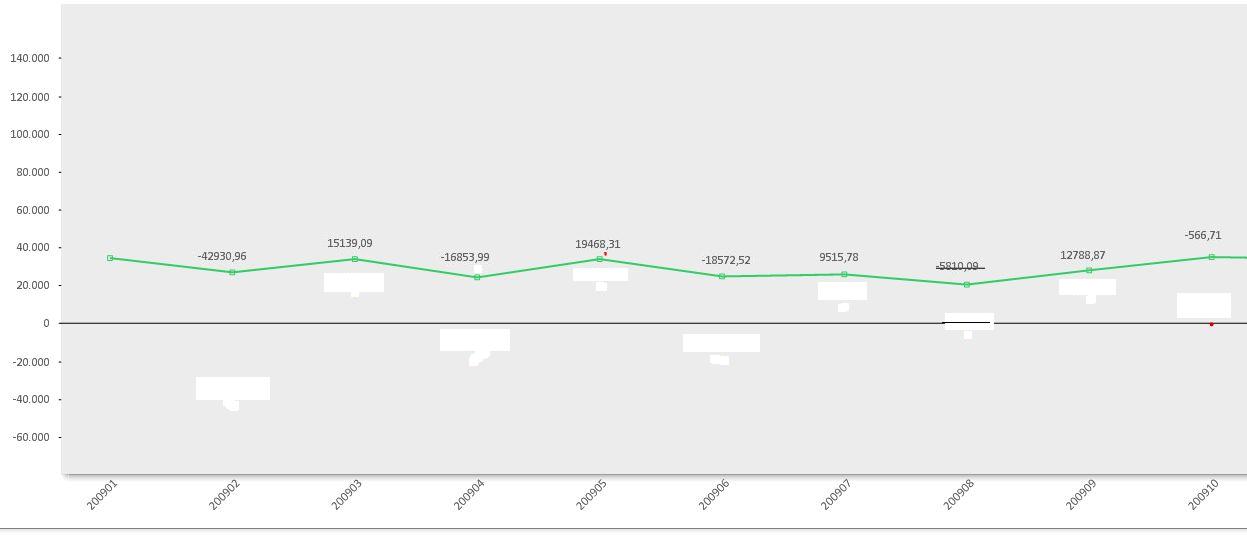
What I want to achive is to display this number but in the green line, even when they are different expressions. Where the red crosses are.
Thanks in advance.
- « Previous Replies
-
- 1
- 2
- Next Replies »
- Mark as New
- Bookmark
- Subscribe
- Mute
- Subscribe to RSS Feed
- Permalink
- Report Inappropriate Content
go to chart properties->expression-. seleect expression(red cross)-> check line
and go to properties->colors -. and chnge the color you want on clicking on different color button give
- Mark as New
- Bookmark
- Subscribe
- Mute
- Subscribe to RSS Feed
- Permalink
- Report Inappropriate Content
Thanks Sunil and sorry but I think I may have not explain myself well. What I want is to "lift up" these values (Expression B) until the line of the Expression A as if they belonged to the Expression A. I assume that any change has to be done in the Expression A (the green line), in one of its properties, that allows to show a calculated value. But I don`t know how.
- Mark as New
- Bookmark
- Subscribe
- Mute
- Subscribe to RSS Feed
- Permalink
- Report Inappropriate Content
Hi,
I could not under stand properly as i under stand what you want to show is calculated values of green line if so select Values on data point in the chart properties.Please provide details.
Sorry if i not under stand correctly
Let me know about this.
Rgds
Anand
- Mark as New
- Bookmark
- Subscribe
- Mute
- Subscribe to RSS Feed
- Permalink
- Report Inappropriate Content
Hi, Anan my intention is that the green line shows in every YearMonth point another value instead its originals. I attach the file. What I want is the values of the expression Difference over the green line (expression Debt)?
Thanks.
- Mark as New
- Bookmark
- Subscribe
- Mute
- Subscribe to RSS Feed
- Permalink
- Report Inappropriate Content
Hi,
Ok as i understand you want to show values correctly or it shows wrong values if so i do some changes in expression please see the attached file.I make your value as 2 decimal places and also make some space in the chart
Let me know about this if i wrong.
HTH
Rgds
Anand
- Mark as New
- Bookmark
- Subscribe
- Mute
- Subscribe to RSS Feed
- Permalink
- Report Inappropriate Content
No, I try to show the values of the expression Difference instead of the values of the expression Debt. I If I could do this, I would not have to display the Difference Expression (Red Dotd). I`d turn it into invisible.
- Mark as New
- Bookmark
- Subscribe
- Mute
- Subscribe to RSS Feed
- Permalink
- Report Inappropriate Content
What I have now

What I should be
- Mark as New
- Bookmark
- Subscribe
- Mute
- Subscribe to RSS Feed
- Permalink
- Report Inappropriate Content
Hi,
Ok understood see the attached sample file, might be it is u r solution.
Rgds
Anand
- Mark as New
- Bookmark
- Subscribe
- Mute
- Subscribe to RSS Feed
- Permalink
- Report Inappropriate Content
No, It doesn´t work. See what happens when I turn into "invisible" the Expressions Invoice and Payments, and I change the scale of the Y-axis with 100.000 as Maximum value.

See that the values remain below the green line.

I attach the file so you can check.
Maybe It can`t be done. I really appreciate you interest.
Thanks a lot.
- « Previous Replies
-
- 1
- 2
- Next Replies »