Unlock a world of possibilities! Login now and discover the exclusive benefits awaiting you.
- Qlik Community
- :
- All Forums
- :
- QlikView App Dev
- :
- How to show data from the current year using set a...
- Subscribe to RSS Feed
- Mark Topic as New
- Mark Topic as Read
- Float this Topic for Current User
- Bookmark
- Subscribe
- Mute
- Printer Friendly Page
- Mark as New
- Bookmark
- Subscribe
- Mute
- Subscribe to RSS Feed
- Permalink
- Report Inappropriate Content
How to show data from the current year using set analyses?
Hello everyone,
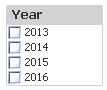
I am trying to create a bar chart where i would like to display data from the current year by category, but it should be dynamic, user can view other years by clicking in the filter:
I am just using the field name in my expression, and using the field "Category" as a dimension.
I can´t use triggers, once it will set the rule for all objects in my sheet.
So, how can i create the rule to display the current year in my chart?
Thanks
- Tags:
- new_to_qlikview
- « Previous Replies
-
- 1
- 2
- Next Replies »
- Mark as New
- Bookmark
- Subscribe
- Mute
- Subscribe to RSS Feed
- Permalink
- Report Inappropriate Content
Add this to your expression's set analysis:
{<Year = {"$(=Max(Year))"}>}
- Mark as New
- Bookmark
- Subscribe
- Mute
- Subscribe to RSS Feed
- Permalink
- Report Inappropriate Content
or this:
{<Year = {"$(=If(GetFieldSelections(Year) = 0, Year(Today()), Max(Year)))"}>}
- Mark as New
- Bookmark
- Subscribe
- Mute
- Subscribe to RSS Feed
- Permalink
- Report Inappropriate Content
Hi Sunny,
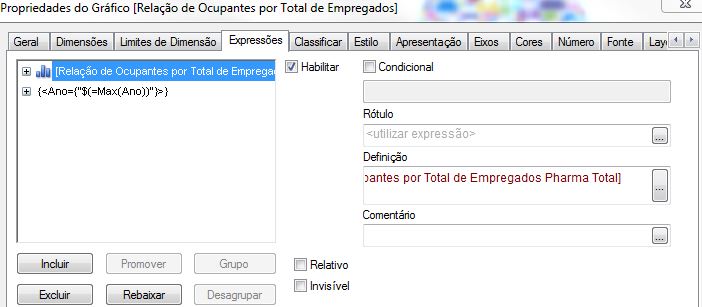
The name of the field for Year is "Ano".
Should i use the name of the field in the expression you suggested, or should i use "Year" exactly how you wrote?
Thanks
- Mark as New
- Bookmark
- Subscribe
- Mute
- Subscribe to RSS Feed
- Permalink
- Report Inappropriate Content
So something like this:
{<Ano= {"$(=Max(Ano))"}>}
or
{<Ano= {"$(=If(GetFieldSelections(Ano) = 0, Year(Today()), Max(Ano)))"}>}
- Mark as New
- Bookmark
- Subscribe
- Mute
- Subscribe to RSS Feed
- Permalink
- Report Inappropriate Content
{Year={$(=max(Year))}>}
- Mark as New
- Bookmark
- Subscribe
- Mute
- Subscribe to RSS Feed
- Permalink
- Report Inappropriate Content
Hi,
Or you can try something like {Ano={$(vYear)}}
Create a variable vYear -
Year(Today())
Mark
- Mark as New
- Bookmark
- Subscribe
- Mute
- Subscribe to RSS Feed
- Permalink
- Report Inappropriate Content
Thanks for your quick answer!
Should i have 2 expressions in my chart?
One for the dimension and another for the set analyses?
- Mark as New
- Bookmark
- Subscribe
- Mute
- Subscribe to RSS Feed
- Permalink
- Report Inappropriate Content
No you just need one expression. What is your current expression?
- Mark as New
- Bookmark
- Subscribe
- Mute
- Subscribe to RSS Feed
- Permalink
- Report Inappropriate Content
I have two situations:
1) A chart that displays the sum of the field "Occupants" by category
2) A chart that displays the percentage of "Occupants" by category.
Both charts should display data from the current Year.
- « Previous Replies
-
- 1
- 2
- Next Replies »