Unlock a world of possibilities! Login now and discover the exclusive benefits awaiting you.
- Qlik Community
- :
- All Forums
- :
- QlikView App Dev
- :
- How to show each value with Bar in Bar chart
- Subscribe to RSS Feed
- Mark Topic as New
- Mark Topic as Read
- Float this Topic for Current User
- Bookmark
- Subscribe
- Mute
- Printer Friendly Page
- Mark as New
- Bookmark
- Subscribe
- Mute
- Subscribe to RSS Feed
- Permalink
- Report Inappropriate Content
How to show each value with Bar in Bar chart
Hello Experts,
Iam using the data is in below attached manner.Here i want show the value of Cycle column in Y-axis ,Subject_area in X-axis
and the column of completion_status is shown with bars if Yes means Green,No means Red using the Cycle values.
Thanks in advanced.
- « Previous Replies
-
- 1
- 2
- Next Replies »
- Mark as New
- Bookmark
- Subscribe
- Mute
- Subscribe to RSS Feed
- Permalink
- Report Inappropriate Content
Hi,
Iam using the same as your mention type,but here if A having three values then the three values are added and shown in one bar.
Now my point is A is shows three bars with three values.
Thanks
- Mark as New
- Bookmark
- Subscribe
- Mute
- Subscribe to RSS Feed
- Permalink
- Report Inappropriate Content
Hi,
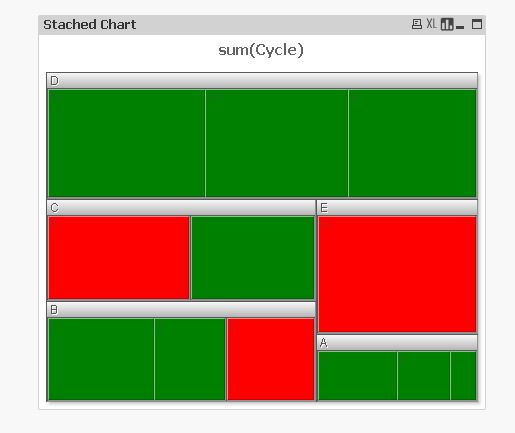
Then add cycle in dimension.
Also if this dont solve your problem, please attach sample output.
- Mark as New
- Bookmark
- Subscribe
- Mute
- Subscribe to RSS Feed
- Permalink
- Report Inappropriate Content
Thanks.
Its working.You are more support to me solve this chart. I am attaching the output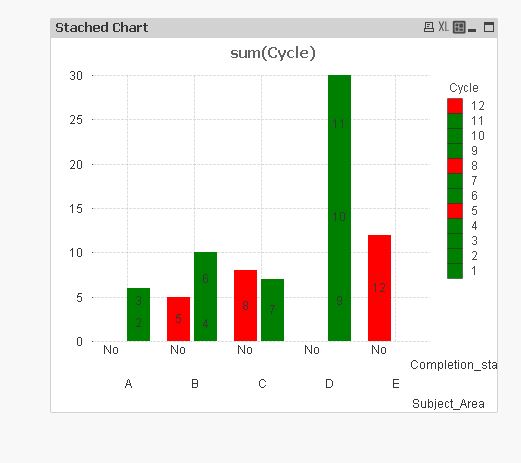
- « Previous Replies
-
- 1
- 2
- Next Replies »