Unlock a world of possibilities! Login now and discover the exclusive benefits awaiting you.
- Qlik Community
- :
- All Forums
- :
- QlikView App Dev
- :
- How to show in a bar chart the quarter by quarter ...
Options
- Subscribe to RSS Feed
- Mark Topic as New
- Mark Topic as Read
- Float this Topic for Current User
- Bookmark
- Subscribe
- Mute
- Printer Friendly Page
Turn on suggestions
Auto-suggest helps you quickly narrow down your search results by suggesting possible matches as you type.
Showing results for
Not applicable
2015-03-19
08:21 AM
- Mark as New
- Bookmark
- Subscribe
- Mute
- Subscribe to RSS Feed
- Permalink
- Report Inappropriate Content
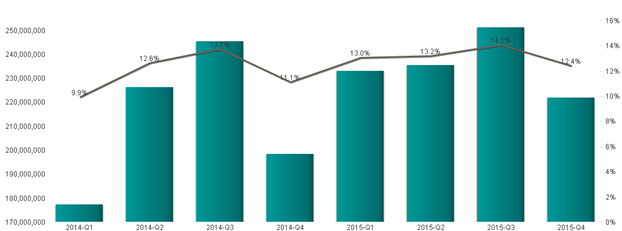
How to show in a bar chart the quarter by quarter change as a %?
Hi there,
How could I represent quarter by quarter change as a %, on the line graph on this bar chart? For example, 2014-Q2 (225k) to 2014-Q1 (175k) is 28.6% var % quarter by quarter, but here it shows 9.9% which is the relative % of the overall volume on the graphical representation.
Thanks very much!
DK
656 Views
1 Reply
Specialist
2015-03-19
11:35 AM
- Mark as New
- Bookmark
- Subscribe
- Mute
- Subscribe to RSS Feed
- Permalink
- Report Inappropriate Content
aggr(sum(Value)-Above(sum(Value)), Quarter)/sum(Value)
Hope this helps
503 Views