Unlock a world of possibilities! Login now and discover the exclusive benefits awaiting you.
- Qlik Community
- :
- All Forums
- :
- QlikView App Dev
- :
- How to show month and days value in one expression
- Subscribe to RSS Feed
- Mark Topic as New
- Mark Topic as Read
- Float this Topic for Current User
- Bookmark
- Subscribe
- Mute
- Printer Friendly Page
- Mark as New
- Bookmark
- Subscribe
- Mute
- Subscribe to RSS Feed
- Permalink
- Report Inappropriate Content
How to show month and days value in one expression
Hi ,
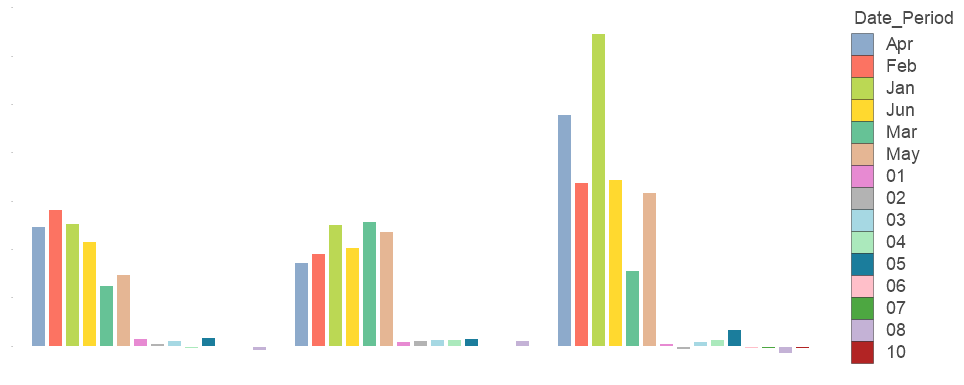
I have one bar chart and i want to show months value as well as days value.
My logic would be compare the month from one date field Mydate , if Mydate is current month then only sum up days value, then show me all the months value except except the current month.
I have one field which represent month value as well as days value based on the selection (Rep_Field) is the below syntax
Here is my expression.
I have two dimensions, location and Date_Period and below expression;
sum({<Rep={'Current Year By Month','Current Month By Day'},Date_Period-={'=month(max(Mydate ))'}>}Val)
Rep= Current Year By Month - gives months like Jan, Feb, Mar..
Rep=Current Month By Day - gives days like, 01,03...31
Currently i am getting months and days value in the char .. I want days values to be summed up and show only one bar. Please see the image what i am getting now.
Please advise how to accumulated all the days and get only one bar for it.
- Mark as New
- Bookmark
- Subscribe
- Mute
- Subscribe to RSS Feed
- Permalink
- Report Inappropriate Content
I suspect the reason you have gotten no response on this one is the need for folks to be able to see things directly, so if there is any chance you can attach the app or a sample app that will show what you have going on with just sample data, that would likely work too.
The only other thing I have for you is the following link:
https://community.qlik.com/t5/Qlik-Design-Blog/bg-p/qlik-design-blog
This is to the Design Blog area of the Community, where many of our experts have written up how-to's on a lot of different subjects. I would have posted something more detailed, but I am not quite sure myself where you actually need help here, so throw a few search terms in on that link and see anything you find there may help you get what you need. Sorry I do not have anything better for you.
Regards,
Brett
I now work a compressed schedule, Tuesday, Wednesday and Thursday, so those will be the days I will reply to any follow-up posts.