Unlock a world of possibilities! Login now and discover the exclusive benefits awaiting you.
- Qlik Community
- :
- All Forums
- :
- QlikView App Dev
- :
- How to show only last 6 months date.
- Subscribe to RSS Feed
- Mark Topic as New
- Mark Topic as Read
- Float this Topic for Current User
- Bookmark
- Subscribe
- Mute
- Printer Friendly Page
- Mark as New
- Bookmark
- Subscribe
- Mute
- Subscribe to RSS Feed
- Permalink
- Report Inappropriate Content
How to show only last 6 months date.
Hi,
I want to show the only last 6 months date in the chart .
Is it possible.
How to filer the date in the chart .
- « Previous Replies
-
- 1
- 2
- Next Replies »
Accepted Solutions
- Mark as New
- Bookmark
- Subscribe
- Mute
- Subscribe to RSS Feed
- Permalink
- Report Inappropriate Content
if you take a look at the script you will see that i generated a mastercalendar
and some variables eg.vZeitraum6Monate and vAktuellerMonat.
the mastercalendar is generating a field called ''MonthDiff''. This Field actually assigns
a number to every month. For todays month it should assign the 0 and last month should assign the -1 and for the month before last month it should assign -2 and so on.
vAktuellerMonat (=vActualMonth) <--- =0
vZeitraum6Monate (=vRange6Month) <---- =-5
Because i connected the MC to your DataTable you can now define the ranges with setanalysis in order to get the wished data.
In my app which i uploaded there is a small mistake. In the script
on MC sheet on top you will have to replace
SET vAktuellerMonat = -1;
to:
SET vAktuellerMonat = 0;
hope this helps
- Mark as New
- Bookmark
- Subscribe
- Mute
- Subscribe to RSS Feed
- Permalink
- Report Inappropriate Content
Please upload a small sample qvw.
without knowing your datamodel and fields it might be difficult to assist!
- Mark as New
- Bookmark
- Subscribe
- Mute
- Subscribe to RSS Feed
- Permalink
- Report Inappropriate Content
Hi,
If you are looking for only last 6 month data then you can apply filter in script on From part else you can create on dimension with flag like if its last 6 month then true else false.
You can use following in script..
SET MonthDiff = Num(((year($2) * 12) + month($2)) - (((year($1) * 12) + month($1))) + 1);
Load
if(($(MonthDiff(StartDate, EndDate))<=6,'True','False' AS SixMonthsDifference
From...
Thanks,
Pooja singh
- Mark as New
- Bookmark
- Subscribe
- Mute
- Subscribe to RSS Feed
- Permalink
- Report Inappropriate Content
2 minutes I am preparing the sample.
- Mark as New
- Bookmark
- Subscribe
- Mute
- Subscribe to RSS Feed
- Permalink
- Report Inappropriate Content
no hurry 🙂
- Mark as New
- Bookmark
- Subscribe
- Mute
- Subscribe to RSS Feed
- Permalink
- Report Inappropriate Content
why i cant able to attach qvw
it is not showingi the option
- Mark as New
- Bookmark
- Subscribe
- Mute
- Subscribe to RSS Feed
- Permalink
- Report Inappropriate Content
You are watching this thread through your inbox? if yes, then try doing it by this link:
- Mark as New
- Bookmark
- Subscribe
- Mute
- Subscribe to RSS Feed
- Permalink
- Report Inappropriate Content
Ok
thanks.
My requirement is to show 2 charts
One Line chart having time on x axis for the last 6 months (sep to march) that should show Chrome,IE and firefox
Other line chart having time on xaxis for the last 6 months (sep to march) that should show only IE. versions in our example i didnt create many so thats fine .
I will incorporate the same logic if you can help me pls.
- Mark as New
- Bookmark
- Subscribe
- Mute
- Subscribe to RSS Feed
- Permalink
- Report Inappropriate Content
Hi,
try this... for e.g.
SUM(
{$<
FactTable.Date = {">=$(=MonthStart(Min(Time.Date),-6)) <=$(=MonthEnd(Max(Time.Date)))"}
>}
FactTable.Amount)
Best regards,
German
- Mark as New
- Bookmark
- Subscribe
- Mute
- Subscribe to RSS Feed
- Permalink
- Report Inappropriate Content
Please give more information about the logic behind this requirement!
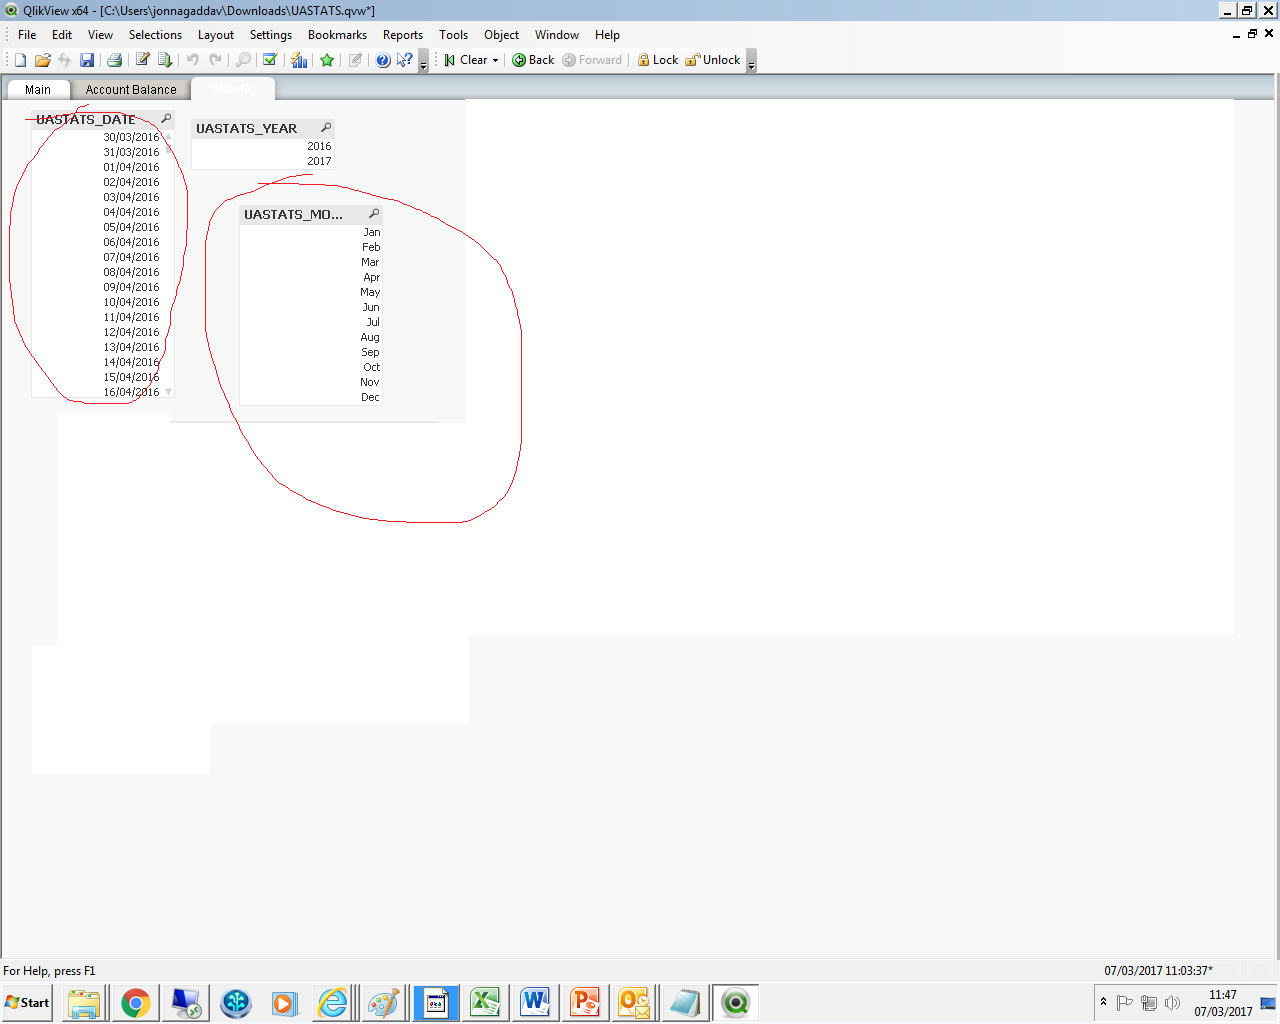
also there is no information about the year in your app!
What should be shown in the linechart? a count of B?
- « Previous Replies
-
- 1
- 2
- Next Replies »