Unlock a world of possibilities! Login now and discover the exclusive benefits awaiting you.
- Qlik Community
- :
- All Forums
- :
- QlikView App Dev
- :
- How to show result from expression when it is null
- Subscribe to RSS Feed
- Mark Topic as New
- Mark Topic as Read
- Float this Topic for Current User
- Bookmark
- Subscribe
- Mute
- Printer Friendly Page
- Mark as New
- Bookmark
- Subscribe
- Mute
- Subscribe to RSS Feed
- Permalink
- Report Inappropriate Content
How to show result from expression when it is null
Hi All,
My chart is quite simple: first column with customer, second column with products, third is the turnover.
Turnover is calculated by the expression sum([UNIT PRICE USD]*QUANTITY)
I would like to show the result through a "-" when the Customer never bought that specific product.
Expression automatically hides the value when sales and quantity are null (they do not exist because customer never bought).
I tried with IsNull but probably there is something I am handling wrong
if(IsNull(QUANTITY) or IsNull([UNIT PRICE USD]),'-',sum([UNIT PRICE USD]*QUANTITY))
Note:
Second column is populated with the list of all available product.
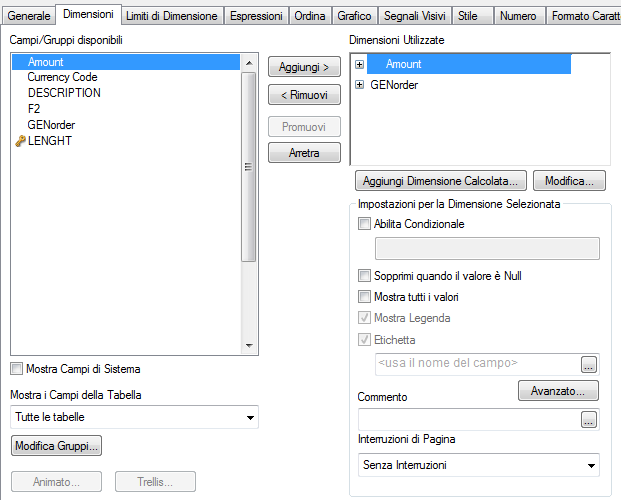
For what concern dimensions, I deselected "suppress when value is null" into chart properties.
but it does not work.
Any help?
- « Previous Replies
-
- 1
- 2
- Next Replies »
- Mark as New
- Bookmark
- Subscribe
- Mute
- Subscribe to RSS Feed
- Permalink
- Report Inappropriate Content
If you uncheck Suppress Zero Values, then you don't need any complexity. This expression
=sum([UNIT PRICE USD]*QUANTITY)\
will return a null if either field is null, nd this will render as '-' as required.
If that does not work, then the values are not null, they are missing (ie there is no instance of at least one of these fields for that row combination of dimension values) and you will need the Populate Missing Cells option. The only other solution then is to consider model changes to resolve the missing values.
- Mark as New
- Bookmark
- Subscribe
- Mute
- Subscribe to RSS Feed
- Permalink
- Report Inappropriate Content
Thanks but as I told above this is what I have for both dimensions.
Sorry for Italian language but I am sure you can understand the meaning.
Into presentation tab I do not have any option to select about Zero-value
- Mark as New
- Bookmark
- Subscribe
- Mute
- Subscribe to RSS Feed
- Permalink
- Report Inappropriate Content
Hi Jonathan,
you are probably very near the solution. Do you have any advice to give me?
Probably I have to work on something that works in this way:
For each customer check the bought products. If they are in it is ok otherwise generate a row for the customer with the missing product with a null field into value and quantity.
Am I right? Probably it is something at script level.
Thanks
- Mark as New
- Bookmark
- Subscribe
- Mute
- Subscribe to RSS Feed
- Permalink
- Report Inappropriate Content
Hi Massimo, if there are no relation between a Product and a Customer, QV will not draw the row for those combinations.
Working with ValueList you can generate all values but I don't know how to do the expression if there are too much combinations, the calculated dimension that returns all values can be:
=ValueList($(=Chr(39) & Concat(DISTINCT Product, Chr(39) &',' & Chr(39)) & Chr(39)))
If possible I think your best option is to generate the missing data, ie:
Data:
LOAD * Inline [
Customer, Product, Sales
A,1,8
B,1,3
B,2,4
B,3,5
C,1,5
C,2,4
];
DataPopulated:
NoConcatenate LOAD Distinct Customer Resident Data;
Join LOAD Distinct Product, 0 as Sales Resident Data;
Concatenate (Data) LOAD * Resident DataPopulated;
DROP Table DataPopulated;
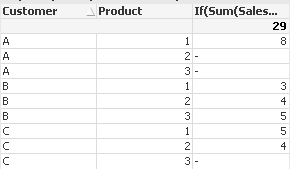
Then you can use the expression: If(Sum(Sales)=0, '-', Sum(Sales))
Returns:
- Mark as New
- Bookmark
- Subscribe
- Mute
- Subscribe to RSS Feed
- Permalink
- Report Inappropriate Content
One weird solution, but the peformance can be really affected, even not working at all.
From this script:
Data:
LOAD * Inline [
Customer, Product, Sales
A,1,8
B,1,3
B,2,4
B,3,5
C,1,5
C,2,4
];
With dimensions:
- Customer
- =ValueList($(=Chr(39) & Concat(DISTINCT Product, Chr(39) &',' & Chr(39)) & Chr(39)))
And the expression:
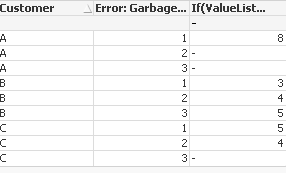
$(=Concat(Aggr('If(ValueList(' & Chr(36) & '(=Chr(39) & Concat(DISTINCT Product, Chr(39) &' & Chr(39) & ',' & Chr(39) & '& Chr(39)) & Chr(39)))=' & Product & ',
If(Sum({<Product={' & Product & '}>} Sales)=0, ' & Chr(39) & '-' & Chr(39) & ',Sum({<Product={' & Product & '}>} Sales)),', Product)) & 'Null()' & Repeat(')', Count(TOTAL DISTINCT Product)))
Returns this:
To explain the expression, when is $-expanded returns this expression:
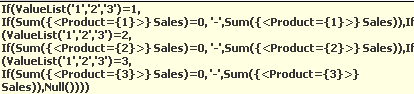
Yep, I'm a bit idle today. 
- Mark as New
- Bookmark
- Subscribe
- Mute
- Subscribe to RSS Feed
- Permalink
- Report Inappropriate Content
>>For each customer check the bought products. If they are in it is ok otherwise generate a row for the customer with the missing product with a null field into value and quantity.
That's pretty much it - nulls will not affect averages, counts and sums of the facts, but be careful of counts of the dimension fields as these could change.
- Mark as New
- Bookmark
- Subscribe
- Mute
- Subscribe to RSS Feed
- Permalink
- Report Inappropriate Content
Hi Ruben,
this could work.
For each customer the script "creates" the link with all products even if they have been never bought.
However when the product is missing into the original table the result is ok but when the product is already existing in the original table (and this should be used) I find two rows: first with product and 0 as sales and a second row where there is the product with the correct amount. (Only this second row should be present for this product)
I think there is something missing in the script.
DataPopulated:
NoConcatenate LOAD Distinct Customer Resident Data;
Join LOAD Distinct Product, 0 as Sales Resident Data;
Probably there should be an instruction "IF product is already existing then use it" but I do not know how to implement it into the script.
- Mark as New
- Bookmark
- Subscribe
- Mute
- Subscribe to RSS Feed
- Permalink
- Report Inappropriate Content
Hi, it was just an example of how to populate data, as you said, if you want to avoid the extra row you can check if the row exists:
Data:
LOAD *, Customer & '#' & Product as Key Inline [
Customer, Product, Sales
A,1,8
B,1,3
B,2,4
B,3,5
C,1,5
C,2,4
];
DataPopulated:
NoConcatenate LOAD Distinct Customer Resident Data;
Join LOAD Distinct Product, 0 as Sales Resident Data;
Concatenate (Data) LOAD * Resident DataPopulated Where not exists('Key', Customer & '#' & Product);
DROP Table DataPopulated;
You should work on the key to fit your real data, in example adding year and month to the key.
- Mark as New
- Bookmark
- Subscribe
- Mute
- Subscribe to RSS Feed
- Permalink
- Report Inappropriate Content
Thank you Ruben!
So far, it works perfectly.
- « Previous Replies
-
- 1
- 2
- Next Replies »