Unlock a world of possibilities! Login now and discover the exclusive benefits awaiting you.
- Qlik Community
- :
- All Forums
- :
- QlikView App Dev
- :
- How to show the legend with values in pie chart
- Subscribe to RSS Feed
- Mark Topic as New
- Mark Topic as Read
- Float this Topic for Current User
- Bookmark
- Subscribe
- Mute
- Printer Friendly Page
- Mark as New
- Bookmark
- Subscribe
- Mute
- Subscribe to RSS Feed
- Permalink
- Report Inappropriate Content
How to show the legend with values in pie chart
Hello Experts,
I want to show the legend with values in pie chart. Below i am attaching images

For this out put i used Dimension: Skillname
Expression1:=Sum({<[Closed date] = {"$(='>=' & Date(Today()-30))"},[Job Status]={Closed}>} [Total No. of Openings])
Expression2:==Sum({<[Closed date] = {"$(='>=' & Date(Today()-30))"},[Job Status]={Closed}>} [Ageing in days])
But i want to show the openings also in legend
For example like this i want
.NET-1
Consulting-1
Can you guys help me for this
Thank you in advance
Regards,
B V S Sudhakar
Accepted Solutions
- Mark as New
- Bookmark
- Subscribe
- Mute
- Subscribe to RSS Feed
- Permalink
- Report Inappropriate Content
Ok, so in Expression tab you just need to uncheck "values on data points" in the expression with openings
- Mark as New
- Bookmark
- Subscribe
- Mute
- Subscribe to RSS Feed
- Permalink
- Report Inappropriate Content
In the presentation tab, check 'Show Numbers in Legend'
- Mark as New
- Bookmark
- Subscribe
- Mute
- Subscribe to RSS Feed
- Permalink
- Report Inappropriate Content
Hi Tresesco,
I tried with that option already, In that case i don't want this expression values in chart because once see the chart it is showing both expression values but i don't want below mentioned expression values and i want those values in legend
Expression1:=Sum({<[Closed date] = {"$(='>=' & Date(Today()-30))"},[Job Status]={Closed}>} [Total No. of Openings])
- Mark as New
- Bookmark
- Subscribe
- Mute
- Subscribe to RSS Feed
- Permalink
- Report Inappropriate Content
Hello, Sudhakar!
Like this?
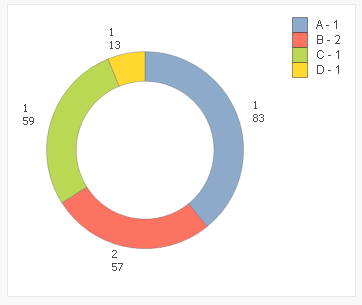
If so - just add to your dimension formula this part: Skillname &' - '& aggr(Count(Openings), Skillname)
- Mark as New
- Bookmark
- Subscribe
- Mute
- Subscribe to RSS Feed
- Permalink
- Report Inappropriate Content
HI Sergey Shuklin,
What you show in legend i want that output but i don't want those values in chart
- Mark as New
- Bookmark
- Subscribe
- Mute
- Subscribe to RSS Feed
- Permalink
- Report Inappropriate Content
Ok, so in Expression tab you just need to uncheck "values on data points" in the expression with openings
- Mark as New
- Bookmark
- Subscribe
- Mute
- Subscribe to RSS Feed
- Permalink
- Report Inappropriate Content
Hi Sergey Shuklin,
Thank you, I am checking all options except that.
Thank you very much for remembering that silly thing