Unlock a world of possibilities! Login now and discover the exclusive benefits awaiting you.
- Qlik Community
- :
- All Forums
- :
- QlikView App Dev
- :
- How to show values in line chart?
- Subscribe to RSS Feed
- Mark Topic as New
- Mark Topic as Read
- Float this Topic for Current User
- Bookmark
- Subscribe
- Mute
- Printer Friendly Page
- Mark as New
- Bookmark
- Subscribe
- Mute
- Subscribe to RSS Feed
- Permalink
- Report Inappropriate Content
How to show values in line chart?
Hi Team,
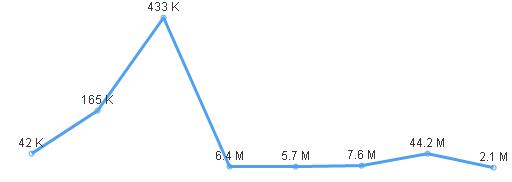
How to show values in Million(m) foramt and thousand(k) foramts in line chart
if(sum(Amount)>=1000000
,num(sum(Amount)/1000000,'#,##0.0 M')
,num(sum(Amount)/1000,'#,##0 K'))
I applied above formula ,but the trend line shows bleow
Millions shows down trend and Thousand shows up trend
Thanks
- « Previous Replies
-
- 1
- 2
- Next Replies »
- Mark as New
- Bookmark
- Subscribe
- Mute
- Subscribe to RSS Feed
- Permalink
- Report Inappropriate Content
Hi,
Please close the Post by clicking correct answer.
Regards,
Kaushik Solanki
- Mark as New
- Bookmark
- Subscribe
- Mute
- Subscribe to RSS Feed
- Permalink
- Report Inappropriate Content
=IF([Student Version] = "no",
[TOTAL SEATS BILLED] * INDEX(SeatSalesFactors[Factor], MATCH([Market] & ":" & [Segment], SeatSalesFactors[Joined Key], 0)),
[TOTAL SEATS BILLED])
if((segement='Post-Secondary') and (market='Emerging') then ((([TOTAL SEATS BILLED])*75)/100)*18),
elseif((segement='Post-Secondary') and (market='Mature') then ((([TOTAL SEATS BILLED])*75)/100)*3),
elseif((segement='Secondary') and (market='Emerging') then ((([TOTAL SEATS BILLED])*75)/100)*15),
elseif((segement='Secondary') and (market='Mature') then ((([TOTAL SEATS BILLED])*75)/100)*5)
else
end if
- « Previous Replies
-
- 1
- 2
- Next Replies »