Unlock a world of possibilities! Login now and discover the exclusive benefits awaiting you.
- Qlik Community
- :
- All Forums
- :
- QlikView App Dev
- :
- How to sort accordingly ?
- Subscribe to RSS Feed
- Mark Topic as New
- Mark Topic as Read
- Float this Topic for Current User
- Bookmark
- Subscribe
- Mute
- Printer Friendly Page
- Mark as New
- Bookmark
- Subscribe
- Mute
- Subscribe to RSS Feed
- Permalink
- Report Inappropriate Content
How to sort accordingly ?
Hi All ,
How can I sort the pivot table according to dimension. Please see the screen shot- My expected result should like
With most Saleable Stock will appear first and so on :-
W10 ,then W30 and then others.

sample model attached.
Accepted Solutions
- Mark as New
- Bookmark
- Subscribe
- Mute
- Subscribe to RSS Feed
- Permalink
- Report Inappropriate Content
Hi,
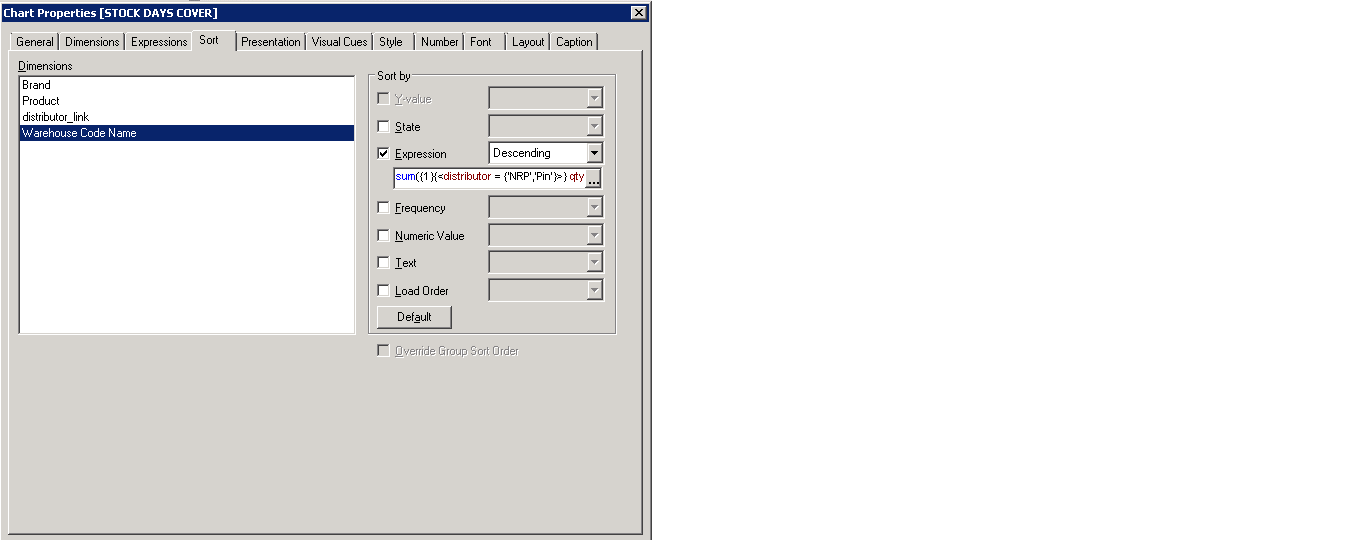
In chart properties --> Sort -- > disable any sort order for the Dimensions - Brand,Product,distributor_link
--> Enable sort by Expression for dimension -Warehouse code name
set the sort by expression - descending and include the expression which you have for 'Salable Stock'
i.e : sum({1}{<distributor = {'NRP','Pin'}>} qty_available)- sum({1}{<distributor = {'NRP','Pin'},[Fiscal_Year]=,[Month]=>}stock_alloc_inv)
Modified sample app attached
- Mark as New
- Bookmark
- Subscribe
- Mute
- Subscribe to RSS Feed
- Permalink
- Report Inappropriate Content
Hi,
In chart properties --> Sort -- > disable any sort order for the Dimensions - Brand,Product,distributor_link
--> Enable sort by Expression for dimension -Warehouse code name
set the sort by expression - descending and include the expression which you have for 'Salable Stock'
i.e : sum({1}{<distributor = {'NRP','Pin'}>} qty_available)- sum({1}{<distributor = {'NRP','Pin'},[Fiscal_Year]=,[Month]=>}stock_alloc_inv)
Modified sample app attached