Unlock a world of possibilities! Login now and discover the exclusive benefits awaiting you.
- Qlik Community
- :
- All Forums
- :
- QlikView App Dev
- :
- How to write a set analysis
- Subscribe to RSS Feed
- Mark Topic as New
- Mark Topic as Read
- Float this Topic for Current User
- Bookmark
- Subscribe
- Mute
- Printer Friendly Page
- Mark as New
- Bookmark
- Subscribe
- Mute
- Subscribe to RSS Feed
- Permalink
- Report Inappropriate Content
How to write a set analysis
Hello all,
I need to show year start month to selected month sales .
if apr-17 is selected then jan 17 to apr-17 sales need to be shown in bar chart

How to write this in set analysis...
Thanks
- « Previous Replies
-
- 1
- 2
- Next Replies »
Accepted Solutions
- Mark as New
- Bookmark
- Subscribe
- Mute
- Subscribe to RSS Feed
- Permalink
- Report Inappropriate Content
You also need to ignore your other filters, because your expression is now filtered by the Floor_Month_year field:
sum({<Floor_Month_year={">=$(=floor(YearStart(Max(Floor_Month_year))))<=$(=floor(Max(Floor_Month_year)))"}, Year, Month, YearMonth, Datenum>}Sales)
- Mark as New
- Bookmark
- Subscribe
- Mute
- Subscribe to RSS Feed
- Permalink
- Report Inappropriate Content
Hi, try this
{< Month_Year, Date = {"$(='>=' & YearStart(Max(Date)) & '<=' & Date(Max(Date)))"} >}
- Mark as New
- Bookmark
- Subscribe
- Mute
- Subscribe to RSS Feed
- Permalink
- Report Inappropriate Content
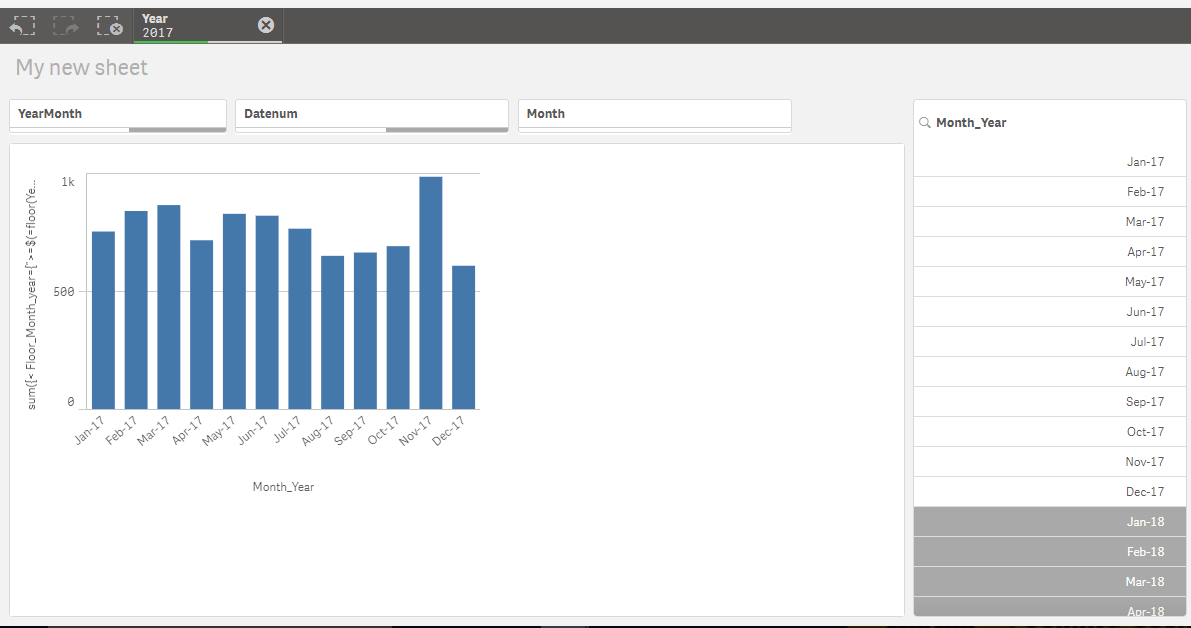
If only a year 2017 is selected then jan to dec Months are showing as below
sum({<Floor_Month_year={">=$(=floor(YearStart(Max(Floor_Month_year))))<=$(=floor(Max(Floor_Month_year)))"}>}Sales)
But when i selected any month (Apr-17) instead of showing Jan-17 to Apr-17 i getting below screen
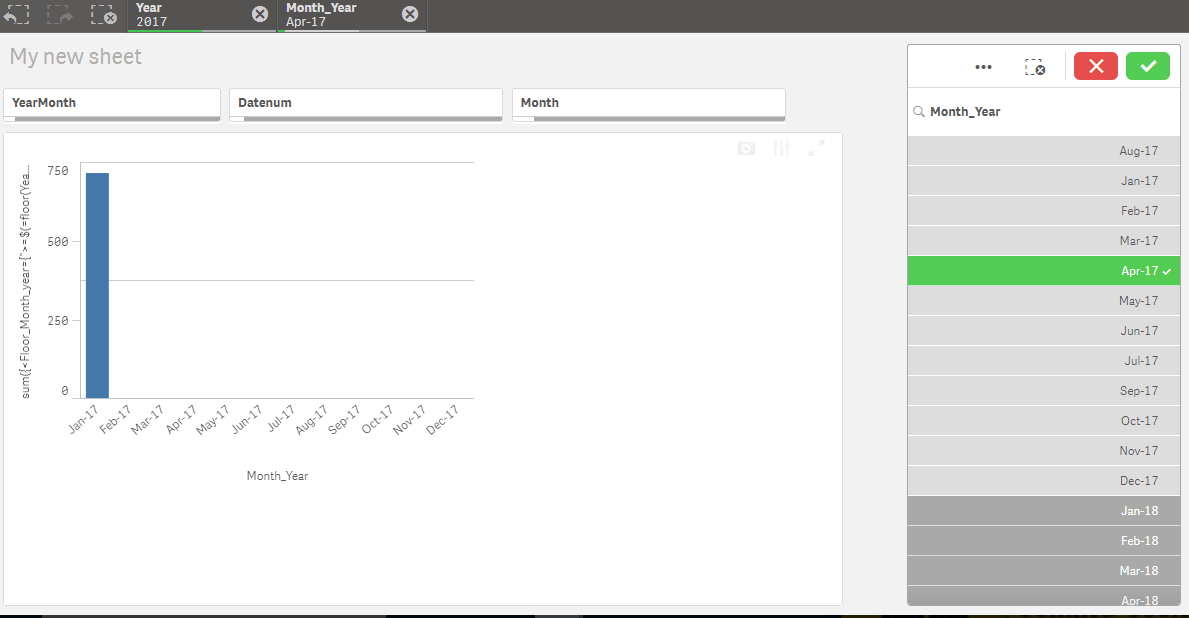
I think i need to change some where in my expression
sum({<Floor_Month_year={">=$(=floor(YearStart(Max(Floor_Month_year))))<=$(=floor(Max(Floor_Month_year)))"}>}Sales)
Any help regarding this
- Mark as New
- Bookmark
- Subscribe
- Mute
- Subscribe to RSS Feed
- Permalink
- Report Inappropriate Content
Any help on this issue plz
- Mark as New
- Bookmark
- Subscribe
- Mute
- Subscribe to RSS Feed
- Permalink
- Report Inappropriate Content
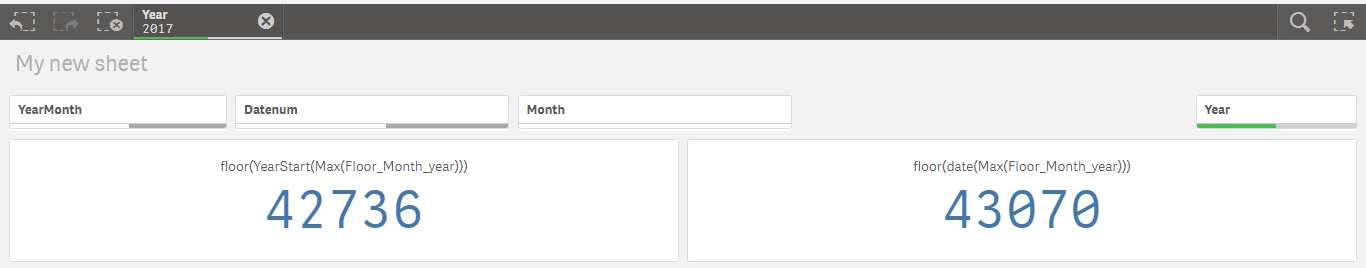
The better way is to create a textbox and see what these expressions give you
=floor(YearStart(Max(Floor_Month_year)))
=floor(Max(Floor_Month_year))
and what you have in Floor_Month_year
- Mark as New
- Bookmark
- Subscribe
- Mute
- Subscribe to RSS Feed
- Permalink
- Report Inappropriate Content
Hello,i did check that
both the expression are giving the correct values individually but when i combined them in a set analysis i am not getting the required output .
Did u see any issue in my expression .
sum({<Floor_Month_year={">=$(=floor(YearStart(Max(Floor_Month_year))))<=$(=floor(Max(Floor_Month_year)))"}>}Sales)
before any month selection it is working fine ,the issue is when i select any month
- Mark as New
- Bookmark
- Subscribe
- Mute
- Subscribe to RSS Feed
- Permalink
- Report Inappropriate Content
Can you post these values?
- Mark as New
- Bookmark
- Subscribe
- Mute
- Subscribe to RSS Feed
- Permalink
- Report Inappropriate Content
When only Year(2017) is selected
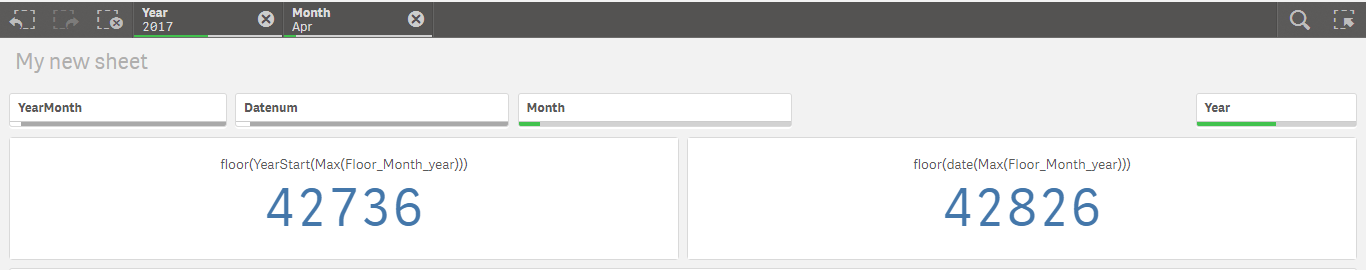
when Year(2017) and Month(Apr) is selected
- Mark as New
- Bookmark
- Subscribe
- Mute
- Subscribe to RSS Feed
- Permalink
- Report Inappropriate Content
You also need to ignore your other filters, because your expression is now filtered by the Floor_Month_year field:
sum({<Floor_Month_year={">=$(=floor(YearStart(Max(Floor_Month_year))))<=$(=floor(Max(Floor_Month_year)))"}, Year, Month, YearMonth, Datenum>}Sales)
- Mark as New
- Bookmark
- Subscribe
- Mute
- Subscribe to RSS Feed
- Permalink
- Report Inappropriate Content
Hi, Juraj. You're right, I just can't figure out how the april selection gives january in the chart
- « Previous Replies
-
- 1
- 2
- Next Replies »