Unlock a world of possibilities! Login now and discover the exclusive benefits awaiting you.
- Qlik Community
- :
- All Forums
- :
- QlikView App Dev
- :
- How to write this expression
- Subscribe to RSS Feed
- Mark Topic as New
- Mark Topic as Read
- Float this Topic for Current User
- Bookmark
- Subscribe
- Mute
- Printer Friendly Page
- Mark as New
- Bookmark
- Subscribe
- Mute
- Subscribe to RSS Feed
- Permalink
- Report Inappropriate Content
How to write this expression
Hi All,
I have those data:
load * Inline
[DayDate,Cohort,MemberId
2013-1-1,1,1
2013-1-1,1,1
2013-1-1,1,1
2013-1-1,1,2
2013-1-1,2,1
2013-1-1,2,2
]
;
And I am using pivot table to show the active MemberId by DayDate by Cohort
The result will be
DayDate, Cohort, ActiveMembers
2013-1-1, 1, 2
2013-1-1,2, 2
For the ActiveMembers, I use count(distinct MemberId), What I want is add one more column to show the total ActiveMembers by DayDate by Cohort. that is 4
DayDate, Cohort, ActiveMembers
2013-1-1, 1, 2
2013-1-1,2, 2
Total: 4
What Shall I do?
Thanks.
- Mark as New
- Bookmark
- Subscribe
- Mute
- Subscribe to RSS Feed
- Permalink
- Report Inappropriate Content
hello,
is this what you want?
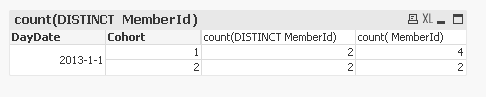
regards
- Mark as New
- Bookmark
- Subscribe
- Mute
- Subscribe to RSS Feed
- Permalink
- Report Inappropriate Content
Make a sub-total for the "DayDate" column and make an Aggregate expression on the dimensions you want to aggregate by.
![2016-10-27 10_48_27-QlikView x64 - [D__Dropbox (Vimur)_Qlikview_examples_273826.qvw_].png](/legacyfs/online/142178_2016-10-27 10_48_27-QlikView x64 - [D__Dropbox (Vimur)_Qlikview_examples_273826.qvw_].png)