Unlock a world of possibilities! Login now and discover the exclusive benefits awaiting you.
- Qlik Community
- :
- All Forums
- :
- QlikView App Dev
- :
- If Condition
- Subscribe to RSS Feed
- Mark Topic as New
- Mark Topic as Read
- Float this Topic for Current User
- Bookmark
- Subscribe
- Mute
- Printer Friendly Page
- Mark as New
- Bookmark
- Subscribe
- Mute
- Subscribe to RSS Feed
- Permalink
- Report Inappropriate Content
If Condition
Hi,
Am showing the trend analysis weekly wise with symbols.
=if( sum({$<WEEK={$(=Max(WEEK))}>}Sales) < sum({$<WEEK={$(=Max(WEEK)-1)}>}Sales) , 0,1)
When am using this expression its comparing last week sales even the last week is not in present that week is treated as '0'.
For Example:
Week Sales
32 100
33 200
34 150
37 300
When am using that expression its taking 36th week as '0'. but i need to compare with last week if its '0' and compare with last of last week even if its '0' it should compare with another previous week. How to write the condition?
Thanks in advance
- « Previous Replies
-
- 1
- 2
- Next Replies »
- Mark as New
- Bookmark
- Subscribe
- Mute
- Subscribe to RSS Feed
- Permalink
- Report Inappropriate Content
Yes Anil. There is no 44th Week data/ Transaction. When writing below expression its taking the 44th week is '0' value and calculating its giving the wrong symbol.
This wrote in layout of that symbol text object.
=if(ceil( sum({$<WEEK={$(=Max(WEEK))}>}Sales)
>
ceil( sum({$<WEEK={$(=Max(WEEK)-1)}>}Sales).
Instead of this ceil( sum({$<WEEK={$(=Max(WEEK)-1)}>}Sales)
can we go for directly transaction week and compare with that value?
- Mark as New
- Bookmark
- Subscribe
- Mute
- Subscribe to RSS Feed
- Permalink
- Report Inappropriate Content
May be this?
=if((ceil(sum({$<WEEK={$(=Max(WEEK))}>}Sales) or Not IsNull(ceil(sum({$<WEEK={$(=Max(WEEK))}>}Sales) or Len(Trim(ceil(sum({$<WEEK={$(=Max(WEEK))}>}Sales)))>ceil(sum({$<WEEK={$(=Max(WEEK)-1)}>}Sales)
- Mark as New
- Bookmark
- Subscribe
- Mute
- Subscribe to RSS Feed
- Permalink
- Report Inappropriate Content
I will Check it Anil Thanks for you quick response
- Mark as New
- Bookmark
- Subscribe
- Mute
- Subscribe to RSS Feed
- Permalink
- Report Inappropriate Content
No Anil. Its not working.
I need some help
The Below is the expression am using in my image text object layout
=if(ceil( sum({$<WEEK={$(=Max(WEEK))}>} [Safety Voilance])/sum({$<WEEK={$(=Max(WEEK))}>}[Kms Travelled])*1000)
>
ceil( sum({$<WEEK={$(=Max(WEEK)-1)}>}[Safety Voilance])/sum({$<WEEK={$(=Max(WEEK)-1)}>}[Kms Travelled])*1000) 1,0)
But its comparing with last week but i need if there is no week it should skipped that week and compare with the week which is in the x axis.
Weeks are 42 , 43,44,45.
In this current week is 45
so there is no 43 and 44 weeks in my trend then it should compare with 42.
- Mark as New
- Bookmark
- Subscribe
- Mute
- Subscribe to RSS Feed
- Permalink
- Report Inappropriate Content
Will you able to provide sample?
- Mark as New
- Bookmark
- Subscribe
- Mute
- Subscribe to RSS Feed
- Permalink
- Report Inappropriate Content
Yes Sure. I will do it now
- Mark as New
- Bookmark
- Subscribe
- Mute
- Subscribe to RSS Feed
- Permalink
- Report Inappropriate Content
Hi,
There are 4 analysis scr, hr, AR, MR. When you are clicking on anyone it should be show that analysis along with respective symbols. and same for all.
((The trend will show the last 12 weeks of data , the score will be calculated as total number of violations in week / total km driven * 1000 , the score will show green , yellow , red according to the scr value (<20 green , Yellow (20 - 50) , > 50 will show RED)
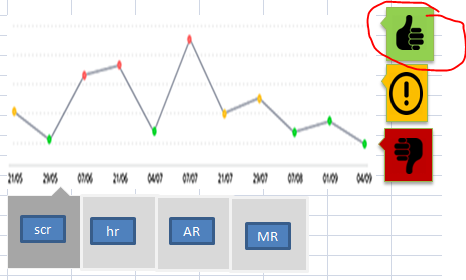
Thanks in advance
- Mark as New
- Bookmark
- Subscribe
- Mute
- Subscribe to RSS Feed
- Permalink
- Report Inappropriate Content
That's lot make sense. But, Difficult to answer without having something?
If(Measure < 20, Image1, If(Measure >20 and Measure <50, Image2, Image3))
- Mark as New
- Bookmark
- Subscribe
- Mute
- Subscribe to RSS Feed
- Permalink
- Report Inappropriate Content
- Mark as New
- Bookmark
- Subscribe
- Mute
- Subscribe to RSS Feed
- Permalink
- Report Inappropriate Content
Question answered.. So, No need to reply here. Create one more thread with excellent inputs..
- « Previous Replies
-
- 1
- 2
- Next Replies »