Unlock a world of possibilities! Login now and discover the exclusive benefits awaiting you.
- Qlik Community
- :
- All Forums
- :
- QlikView App Dev
- :
- Improve Structure of Import Excel and Diplay on Pi...
- Subscribe to RSS Feed
- Mark Topic as New
- Mark Topic as Read
- Float this Topic for Current User
- Bookmark
- Subscribe
- Mute
- Printer Friendly Page
- Mark as New
- Bookmark
- Subscribe
- Mute
- Subscribe to RSS Feed
- Permalink
- Report Inappropriate Content
Improve Structure of Import Excel and Diplay on Pivot Table
Hello,
I would like to improve my Data Structure because currently i used freeze set expression and it is not steady if new indicators will appear.
My data are taken from Excel File with a loop thanks to the folder address:
For each File in filelist('Z:\*.xlsx*')
LOAD Folder,
Pc,
[Pnl_Notion/CFP-CMM/EUR],
[Pnl_Notion/CFP-CMM/USD],
[Pnl_Notion/E.D.M./EUR],
[Pnl_Notion/E.D.M./USD],
[Pnl_Notion/Final Result Acc/EUR],
[Pnl_Notion/Final Result Acc/USD],
[Pnl_Notion/Net Trade Result/EUR],
[Pnl_Notion/Net Trade Result/USD],
[Pnl_Notion/Reallo CVA / DVA/EUR],
[Pnl_Notion/Reallo CVA / DVA/USD],
[Pnl_Notion/Retro Cooperation 2/EUR],
[Pnl_Notion/Retro Cooperation 2/USD],
[Pnl_Notion/SLS Final Result/EUR],
[Pnl_Notion/SLS Final Result/USD],
[Pnl_Notion/SMTD Impact/EUR],
[Pnl_Notion/SMTD Impact/USD],
[Pnl_Notion/SR IN TRD/EUR],
[Pnl_Notion/SR IN TRD/USD],
[Pnl_Notion/Sales Credits Newedge/EUR],
[Pnl_Notion/Sales Credits Newedge/USD],
FROM
[$(File)]
(ooxml, embedded labels, header is 1 lines, table is [Data])
NEXT
Here all data are stock in the table [Data].
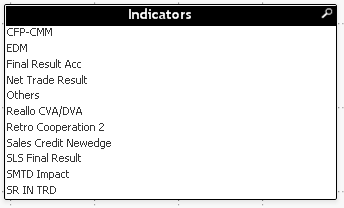
Now i would like to create a Table, named for example 'Indicators', which regroup all field which start with [PNL Notion/ .... ] automatically in the import and create a pivot table which display the data (PNL Notion) according to the choice of this field (Indicators).
Currently i have setup this:
LOAD * INLINE [
AIR_Indicators
Final Result Acc
EDM
Net Trade Result
Reallo CVA/DVA
Retro Cooperation 2
Sales Credit Newedge
SLS Final Result
SMTD Impact
SR IN TRD
CFP-CMM
Others
];

The expression looks like this for each notions:
if(Currency = 'EUR', SUM([Pnl_Notion/Final Result Acc/EUR]),
if(Currency = 'USD', SUM([Pnl_Notion/Final Result Acc/USD])))
Currently the expression are not in link with the table Indicators, but i would like to do this but not like because I think it is too steady:
if(Indicators = 'Final Result Acc' ,if(Currency = 'EUR', SUM([Pnl_Notion/Final Result Acc/EUR]),
if(Currency = 'USD', SUM([Pnl_Notion/Final Result Acc/USD]))))
The notion are displayed one by one because i setup a group:

How can i simplify that please ?
Thanks you in advance for your help,
Sébastien.
- « Previous Replies
-
- 1
- 2
- Next Replies »
- Mark as New
- Bookmark
- Subscribe
- Mute
- Subscribe to RSS Feed
- Permalink
- Report Inappropriate Content
Hi,
You can add one column in indicator table with following value Pnl_Notion/CFP-CMM/ , Pnl_Notion/Net Trade Result/ and so on.
after that you can use expression like
=SUM($(='['&NewColumnName&Currency&']')) and it will be dynamic
Please use the following script and you need to have alway one selected setting ON on Indicator listbox and Currency Lisbox.
LOAD * INLINE [
campaign_id, batch_id, Pnl_Notion/CFP-CMM/EUR, Pnl_Notion/CFP-CMM/USD, Pnl_Notion/Net Trade Result/EUR, Pnl_Notion/Net Trade Result/USD, Pnl_Notion/SLS Final Result/USD
1, 34, 1, 34, 1, 34, 34
2, 34, 2, 34, 2, 34, 34
3, 34, 3, 35, 3, 35, 35
4, 35, 4, 36, 4, 36, 36
5, 36, 5, 36, 5, 36, 36
6, 36, 6, 36, 6, 36, 36
7, 36, 7, 36, 7, 36, 36
8, 36, 8, 34, 8, 34, 34
9, 34, 9, 35, 9, 35, 35
10, 35, 10, 35, 10, 35, 35
11, 35, 11, 35, 11, 35, 35
12, 35, 12, 35, 12, 35, 35
13, 35, 13, 35, 13, 35, 35
14, 35, 14, 35, 14, 35, 35
];
Indicators:
LOAD * INLINE [
Indicators, ColumnName
AIR_Indicators, Pnl_Notion/CFP-CMM/
Final Result Acc
EDM, Pnl_Notion/E.D.M./
Net Trade Result, Pnl_Notion/Net Trade Result/
Reallo CVA/DVA, Pnl_Notion/Reallo CVA / DVA/
Retro Cooperation 2, Pnl_Notion/Retro Cooperation 2/
Sales Credit Newedge, Pnl_Notion/Sales Credits Newedge/
SLS Final Result, Pnl_Notion/SLS Final Result/
SMTD Impact, Pnl_Notion/SMTD Impact/
SR IN TRD, Pnl_Notion/SR IN TRD/
CFP-CMM, Pnl_Notion/CFP-CMM/
];
Currency:
LOAD * INLINE [
Currency
USD
EUR
];
If you want you can create your INDICATOR Dynamically to include new fields.
- Mark as New
- Bookmark
- Subscribe
- Mute
- Subscribe to RSS Feed
- Permalink
- Report Inappropriate Content
Hi,
Try lik tis
subfield(S, '/' ,2) returns 'cde' if S is
[Pnl_Notion/CFP-CMM/EUR]
- Mark as New
- Bookmark
- Subscribe
- Mute
- Subscribe to RSS Feed
- Permalink
- Report Inappropriate Content
Thanks for your response but i am sorry, i don't understand your proposition:
SUM($(='['&NewColumnName&Currency&']'))
Do you think that i need to change my structure of data for that ?
Sébastien.
- Mark as New
- Bookmark
- Subscribe
- Mute
- Subscribe to RSS Feed
- Permalink
- Report Inappropriate Content
Thanks but i do not understand the aim of this proposition 😕
Sébastien.
- Mark as New
- Bookmark
- Subscribe
- Mute
- Subscribe to RSS Feed
- Permalink
- Report Inappropriate Content
Please find attached my data set, how can i modify this into QlikView to have just 3 column with PC, Indicators and Val ?
It would improve my data access.
Sébastien.
- Mark as New
- Bookmark
- Subscribe
- Mute
- Subscribe to RSS Feed
- Permalink
- Report Inappropriate Content
Please do you have an idea ? Can i transpose this sample of data into 3 columns ?
Thanks in advance for your help,
Sébastien.
- « Previous Replies
-
- 1
- 2
- Next Replies »