Unlock a world of possibilities! Login now and discover the exclusive benefits awaiting you.
- Qlik Community
- :
- All Forums
- :
- QlikView App Dev
- :
- In Pie representation selected product as one and ...
- Subscribe to RSS Feed
- Mark Topic as New
- Mark Topic as Read
- Float this Topic for Current User
- Bookmark
- Subscribe
- Mute
- Printer Friendly Page
- Mark as New
- Bookmark
- Subscribe
- Mute
- Subscribe to RSS Feed
- Permalink
- Report Inappropriate Content
In Pie representation selected product as one and rest as others....
Hi Friends,
My data having one dimension called as product and one Measure called as sales.
I have requirement to display selected product as one segment and reaming product's has to group as other's in pie chart.


In the above picture we have used product as filter when i am selecting one product it should display the selected product and rest of the products as others in pie chart.
Please help me in the above issue, Thanks in Advance...:)
Regards,
Venugopal G
- Tags:
- new_to_qlikview
Accepted Solutions
- Mark as New
- Bookmark
- Subscribe
- Mute
- Subscribe to RSS Feed
- Permalink
- Report Inappropriate Content
Hi,
I have changed the second expression of MIke . Please find attached.
Thanks
Kiran Kumar
- Mark as New
- Bookmark
- Subscribe
- Mute
- Subscribe to RSS Feed
- Permalink
- Report Inappropriate Content
See the attached qvw
- Mark as New
- Bookmark
- Subscribe
- Mute
- Subscribe to RSS Feed
- Permalink
- Report Inappropriate Content
Hi,
I have changed the second expression of MIke . Please find attached.
Thanks
Kiran Kumar
- Mark as New
- Bookmark
- Subscribe
- Mute
- Subscribe to RSS Feed
- Permalink
- Report Inappropriate Content
Hi Mike/Kiran,
Thanks very much for your reply.
How can i show the total percentage of value in pie chart.
Regards,
Venugopal G
- Mark as New
- Bookmark
- Subscribe
- Mute
- Subscribe to RSS Feed
- Permalink
- Report Inappropriate Content
Hi,
Can you explain the process here, I have personal edition only can't open your QVWs.

- Mark as New
- Bookmark
- Subscribe
- Mute
- Subscribe to RSS Feed
- Permalink
- Report Inappropriate Content
Hi Mohan,
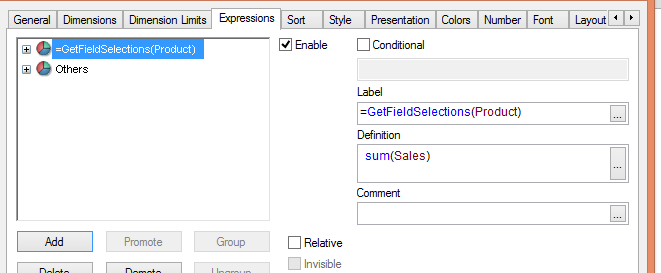
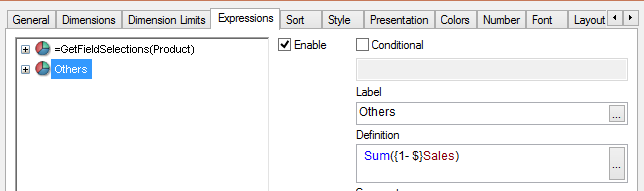
Binary load the file attached above and create a pie chart with out any dimensions.
Create two expressions as follows
1. Sum(Sales)
2. Sum({1-$} Sales)
Thanks
Kiran Kumar
- Mark as New
- Bookmark
- Subscribe
- Mute
- Subscribe to RSS Feed
- Permalink
- Report Inappropriate Content
Please find attached I have created %s for the above same sample.
Thanks
Kiran Kumar
- Mark as New
- Bookmark
- Subscribe
- Mute
- Subscribe to RSS Feed
- Permalink
- Report Inappropriate Content
Hi Kiran,
I want to remove one specific product from others let say Product C.
Because i don't want to include the product c in others.
Please help me ASAP.
Regards,
Venugopal G
- Mark as New
- Bookmark
- Subscribe
- Mute
- Subscribe to RSS Feed
- Permalink
- Report Inappropriate Content
Hi Venu,
I don't think it is possible.
Best Regards
Kiran