Unlock a world of possibilities! Login now and discover the exclusive benefits awaiting you.
- Qlik Community
- :
- All Forums
- :
- QlikView App Dev
- :
- Inactive axes scale of a chart
Options
- Subscribe to RSS Feed
- Mark Topic as New
- Mark Topic as Read
- Float this Topic for Current User
- Bookmark
- Subscribe
- Mute
- Printer Friendly Page
Turn on suggestions
Auto-suggest helps you quickly narrow down your search results by suggesting possible matches as you type.
Showing results for
Not applicable
2014-09-01
04:25 AM
- Mark as New
- Bookmark
- Subscribe
- Mute
- Subscribe to RSS Feed
- Permalink
- Report Inappropriate Content
Inactive axes scale of a chart
Hi,
I have a problem with to many data on my x-axis of chart. I would like to use the axes scale to solve the problem but the axes scale is inactive like on the screen. Does Anybody know what can be the reason ? 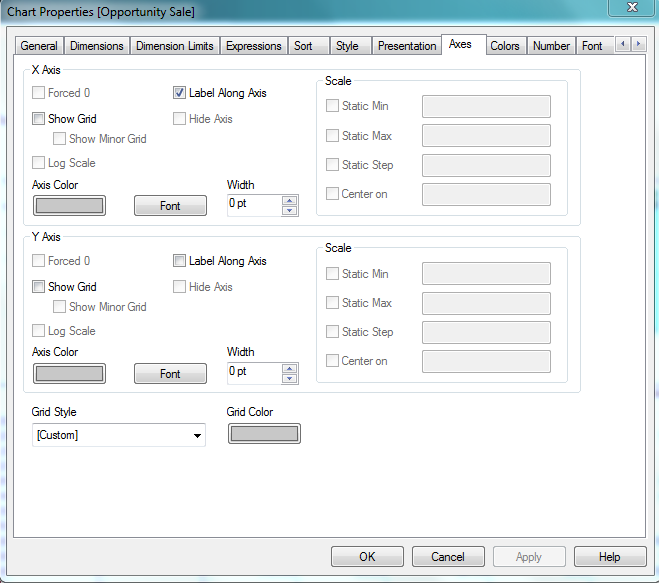
637 Views
4 Replies
Partner - Champion III
2014-09-01
04:54 AM
- Mark as New
- Bookmark
- Subscribe
- Mute
- Subscribe to RSS Feed
- Permalink
- Report Inappropriate Content
What type of chart?
Logic will get you from a to b. Imagination will take you everywhere. - A Einstein
485 Views
Specialist
2014-09-01
04:55 AM
- Mark as New
- Bookmark
- Subscribe
- Mute
- Subscribe to RSS Feed
- Permalink
- Report Inappropriate Content
Questions:
1) Which chart type are you using?
2) Is your x-axis dimension numerical?
485 Views
Employee
2014-09-01
05:07 AM
- Mark as New
- Bookmark
- Subscribe
- Mute
- Subscribe to RSS Feed
- Permalink
- Report Inappropriate Content
Think this is a QlikView question not Qlik Sense.
Scale is only enabled for numeric axes and it looks like this is a grid-chart which has discrete axes.
Maybe you could use the "Chart Scrolling" option on the presentation tab to limit your values?
485 Views
Not applicable
2014-09-01
05:16 AM
Author
- Mark as New
- Bookmark
- Subscribe
- Mute
- Subscribe to RSS Feed
- Permalink
- Report Inappropriate Content
It is a grid chart and the x-axis dimension is numerical.
485 Views