Unlock a world of possibilities! Login now and discover the exclusive benefits awaiting you.
- Qlik Community
- :
- All Forums
- :
- QlikView App Dev
- :
- Interactive mapped chart
- Subscribe to RSS Feed
- Mark Topic as New
- Mark Topic as Read
- Float this Topic for Current User
- Bookmark
- Subscribe
- Mute
- Printer Friendly Page
- Mark as New
- Bookmark
- Subscribe
- Mute
- Subscribe to RSS Feed
- Permalink
- Report Inappropriate Content
Interactive mapped chart
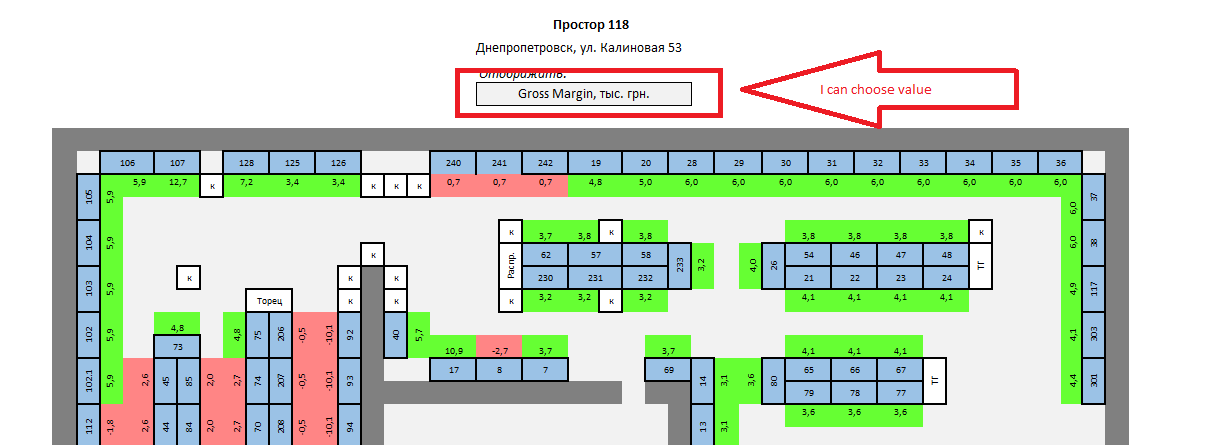
Hi everybody. I have excel spreadsheet, which have attached. And I need to implement similar behaviour of chart in QlikView.
I have to create some chart, which has to react on change chosen value and this reaction has to change color in appropriate cells on the chart. Color of cells depends on value in it. This chart allows to analyse effectiveness of commercial places in outlets.
It think it is very challenging task and i hope that our joint efforts can solve it.
Thanks in advance.
- Mark as New
- Bookmark
- Subscribe
- Mute
- Subscribe to RSS Feed
- Permalink
- Report Inappropriate Content
I think the easiest way would be to create your map like it's created within excel as a matrix of 23 rows * 46 columns = 1058 cells and thereof about 50% because you don't need one for the empty (grey) background cells - only that the creating needs within qlikview more efforts then in excel because you need for each cell a single textbox.
I think it would be possible too, to use several straight tables and line-objects which may lay over eachother and/or over an background-image - but I'm not sure that that will be easier.
Although it needs some efforts it must not take ages then if you had created one textbox of a certain group of your textboxes with the appropriate logic (expressions-loop or variable to react on the user-selections and your color-logig and other layout-requirements) you could simply copy the object and adjust the number within the expression to which number it is related.
Thats many work and probably not the answer which you wanted to hear but if "normal" tables and/or charts aren't enough then is qlikview rather not the most flexible tool. Conceivable are also some kind of extension - I have already seen mappings from inside of buildings but it won't be a simple job to adjust such extension to your needs and therefore you will be already finish with the boring work of creating many textboxes before you have found really valid informations about the possibilities of such extensions.
- Marcus
- Mark as New
- Bookmark
- Subscribe
- Mute
- Subscribe to RSS Feed
- Permalink
- Report Inappropriate Content
Have a look at
Pivot Table Grids | Qlikview Cookbook
For example, the example with the US state map seems quite similar to what you need.
- Mark as New
- Bookmark
- Subscribe
- Mute
- Subscribe to RSS Feed
- Permalink
- Report Inappropriate Content
Hi Stefan,
I have thought on such pivot-grids, too but didn't mentioned it because these map-structure is quite irregular so that it will need many loops to cover them. Do you think it's really easier respectively a sensible alternatives to my textbox-suggestion?
- Marcus