Unlock a world of possibilities! Login now and discover the exclusive benefits awaiting you.
- Qlik Community
- :
- All Forums
- :
- QlikView App Dev
- :
- IntervalTable() not working
- Subscribe to RSS Feed
- Mark Topic as New
- Mark Topic as Read
- Float this Topic for Current User
- Bookmark
- Subscribe
- Mute
- Printer Friendly Page
- Mark as New
- Bookmark
- Subscribe
- Mute
- Subscribe to RSS Feed
- Permalink
- Report Inappropriate Content
IntervalTable() not working
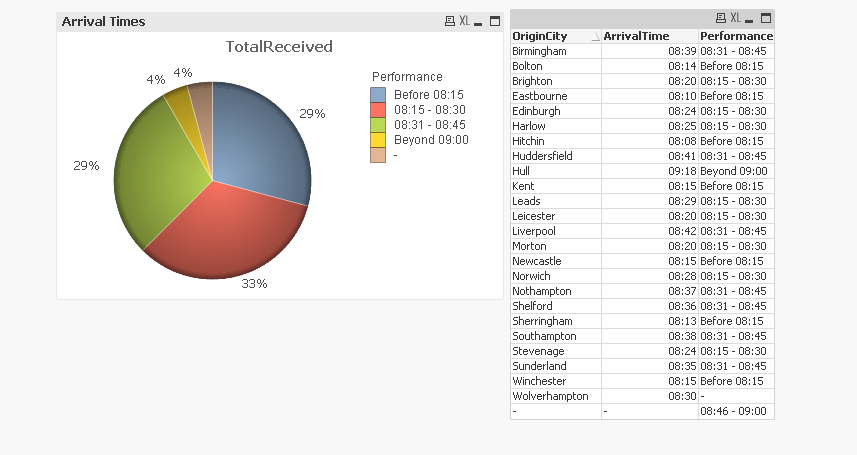
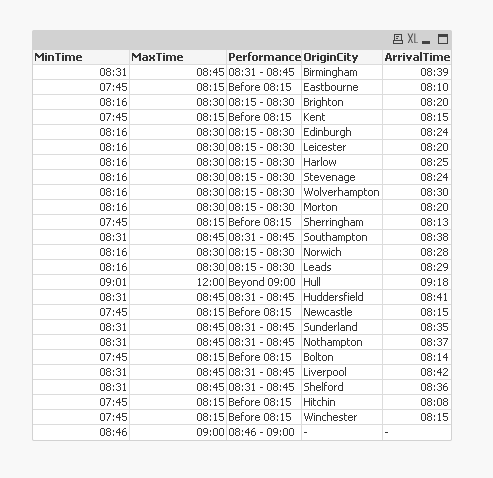
I have a document that i want to track time parcels are received in quarterly bands, this is simple with power pivot but i have to do it in Qlikview. The issue is its not classifying one of the times its simply ignoring it, I have created a pie chart because i want to show it as a pie chart and clearly one of the slices is random i dont know where it came from. I have looked at the code and it seems its not classifying 08:30 for some reason here is the code and i have attached pictures. If there is a better way please advice me.
Performance:
Load * Inline [
MinTime, MaxTime, Performance
07:45, 08:15, Before 08:15
08:16, 08:30, 08:15 - 08:30
08:31, 08:45, 08:31 - 08:45
08:46, 09:00, 08:46 - 09:00
09:01, 12:00, Beyond 09:00
];
Directory;
LOAD OriginCity,
ArrivalTime
FROM
(ooxml, embedded labels, table is Sheet1);
IntervalBridge:
IntervalMatch(ArrivalTime) LOAD MinTime, MaxTime
Resident Performance;
- « Previous Replies
-
- 1
- 2
- Next Replies »
Accepted Solutions
- Mark as New
- Bookmark
- Subscribe
- Mute
- Subscribe to RSS Feed
- Permalink
- Report Inappropriate Content
Seems to work applying the time#() interpretation also to the inline table values.
I assumed it's not necessary at this place, but I stand corrected.
- Mark as New
- Bookmark
- Subscribe
- Mute
- Subscribe to RSS Feed
- Permalink
- Report Inappropriate Content
This could be a rounding issue. The ArrivalTime you load from excel may have a numeric representation little larger than '08:30' as you created in in your Performance table, and smaller than 08:31. Hence it won't match to an existing interval.
Try to round your ArrivalTime values using QV time() and time#() functions, maybe like
Set TimeFormat = 'hh:mm';
Performance:
Load * Inline [
MinTime, MaxTime, Performance
07:45, 08:15, Before 08:15
08:16, 08:30, 08:15 - 08:30
08:31, 08:45, 08:31 - 08:45
08:46, 09:00, 08:46 - 09:00
09:01, 12:00, Beyond 09:00
];
LOAD OriginCity,
Time#(Time(ArrivalTime)) as ArrivalTime
FROM
(ooxml, embedded labels, table is Sheet1);
- Mark as New
- Bookmark
- Subscribe
- Mute
- Subscribe to RSS Feed
- Permalink
- Report Inappropriate Content
This may be:
Performance:
Load Time(Evaluate(MinTime)) as MinTime,
Time(Evaluate(MaxTime)) as MaxTime,
Performance
Inline [
MinTime, MaxTime, Performance
465/1440, 495/1440, Before 08:15
496/1440, 510/1440, 08:15 - 08:30
511/1440, 525/1440, 08:31 - 08:45
526/1440, 540/1440, 08:46 - 09:00
541/1440, 720/1440, Beyond 09:00
];
Directory;
LOAD * Inline [
OriginCity, ArrivalTime
Wolverhampton, 08:30
];
IntervalBridge:
IntervalMatch(ArrivalTime)
LOAD MinTime,
MaxTime
Resident Performance;
- Mark as New
- Bookmark
- Subscribe
- Mute
- Subscribe to RSS Feed
- Permalink
- Report Inappropriate Content
forgot to attache the table from excel anyway its as follows
| OriginCity | ArrivalTime |
| Birmingham | 08:39 |
| Eastbourne | 08:10 |
| Brighton | 08:20 |
| Kent | 08:15 |
| Edinburgh | 08:24 |
| Leicester | 08:20 |
| Harlow | 08:25 |
| Stevenage | 08:24 |
| Wolverhampton | 08:30 |
| Morton | 08:20 |
| Sherringham | 08:13 |
| Southampton | 08:38 |
| Norwich | 08:28 |
| Leads | 08:29 |
| Hull | 09:18 |
| Huddersfield | 08:41 |
| Newcastle | 08:15 |
| Sunderland | 08:35 |
| Nothampton | 08:37 |
| Bolton | 08:14 |
| Liverpool | 08:42 |
| Shelford | 08:36 |
| Hitchin | 08:08 |
| Winchester | 08:15 |
- Mark as New
- Bookmark
- Subscribe
- Mute
- Subscribe to RSS Feed
- Permalink
- Report Inappropriate Content
Script:
Performance:
Load Time(Evaluate(MinTime)) as MinTime,
Time(Evaluate(MaxTime)) as MaxTime,
Performance
Inline [
MinTime, MaxTime, Performance
465/1440, 495/1440, Before 08:15
496/1440, 510/1440, 08:15 - 08:30
511/1440, 525/1440, 08:31 - 08:45
526/1440, 540/1440, 08:46 - 09:00
541/1440, 720/1440, Beyond 09:00
];
Directory;
LOAD * Inline [
OriginCity, ArrivalTime
Birmingham, 08:39
Eastbourne, 08:10
Brighton, 08:20
Kent, 08:15
Edinburgh, 08:24
Leicester, 08:20
Harlow, 08:25
Stevenage, 08:24
Wolverhampton, 08:30
Morton, 08:20
Sherringham, 08:13
Southampton, 08:38
Norwich, 08:28
Leads, 08:29
Hull, 09:18
Huddersfield, 08:41
Newcastle, 08:15
Sunderland, 08:35
Nothampton, 08:37
Bolton, 08:14
Liverpool, 08:42
Shelford, 08:36
Hitchin, 08:08
Winchester, 08:15
];
IntervalBridge:
IntervalMatch(ArrivalTime)
LOAD MinTime,
MaxTime
Resident Performance;
- Mark as New
- Bookmark
- Subscribe
- Mute
- Subscribe to RSS Feed
- Permalink
- Report Inappropriate Content
Thanks a lot that worked, the second option of formatting the ArrivalTime - Time#(Time(ArrivalTime)).
One question i want to count the number so that i can have a correct calculation, when i create count(arrivalTime) expression it only counts unique and not all is there a function similar to DAX like Countrows() opposite of CountDistinct()?
- Mark as New
- Bookmark
- Subscribe
- Mute
- Subscribe to RSS Feed
- Permalink
- Report Inappropriate Content
thank you that worked
- Mark as New
- Bookmark
- Subscribe
- Mute
- Subscribe to RSS Feed
- Permalink
- Report Inappropriate Content
One question i want to count the number so that i can have a correct calculation, when i create count(arrivalTime) expression it only counts unique and not all is there a function similar to DAX like Countrows() opposite of CountDistinct()?
sorry, I don't understand your question. Count(ArrivalTime) should alread give you a non-distinct count.
Could you describe your issue a little more, best with some sample data?
- Mark as New
- Bookmark
- Subscribe
- Mute
- Subscribe to RSS Feed
- Permalink
- Report Inappropriate Content
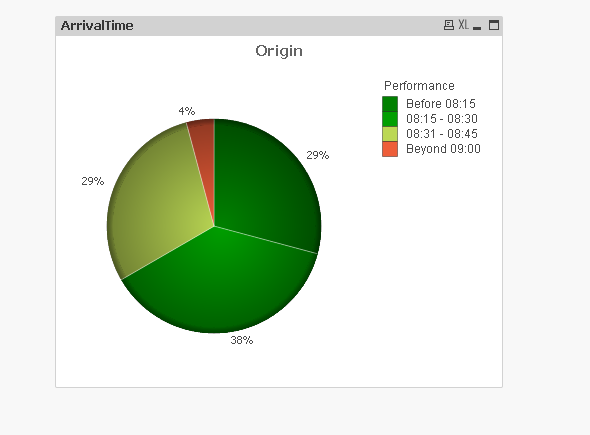
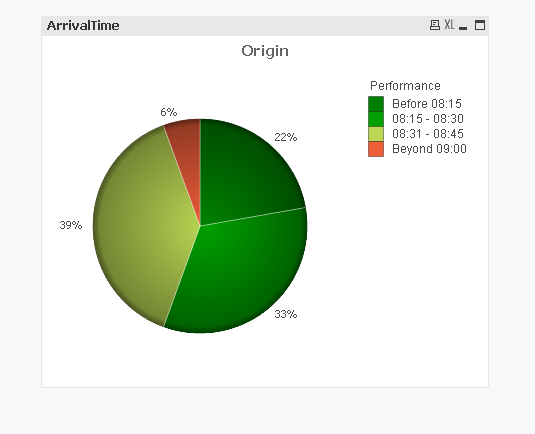 Thank you for the reply. The issue is there is bound to be ArrivalTimes that are the same so with the data above that i shared earlier I have decided to make Eastbourne, Kent and Sherringham ArrivalTime the same and changed them to 08:10. and if i want to do the count of ArrivalTimes that belong to the same Bracket, It seems Qlikview does not count all, it only counts distinct which wrong. i have attached the two results before i make the Eastbourne, Kent and Sherringham the same and after i/ made them the same. the result is different. Please refer to the images attached.
- Mark as New
- Bookmark
- Subscribe
- Mute
- Subscribe to RSS Feed
- Permalink
- Report Inappropriate Content
ArrivalTime is a key field betwen two tables, right?
You should not do a Count(KeyField), that will return no valid value in general. Count a field in one of the tables that show a value for each row you want to consider. In your case, I think you can do
=Count(OriginCity)
- « Previous Replies
-
- 1
- 2
- Next Replies »