Unlock a world of possibilities! Login now and discover the exclusive benefits awaiting you.
- Qlik Community
- :
- All Forums
- :
- QlikView App Dev
- :
- Is it possible to show % and no in bar garph
- Subscribe to RSS Feed
- Mark Topic as New
- Mark Topic as Read
- Float this Topic for Current User
- Bookmark
- Subscribe
- Mute
- Printer Friendly Page
- Mark as New
- Bookmark
- Subscribe
- Mute
- Subscribe to RSS Feed
- Permalink
- Report Inappropriate Content
Is it possible to show % and no in bar garph
Hi Team,
Attached the qvw file.
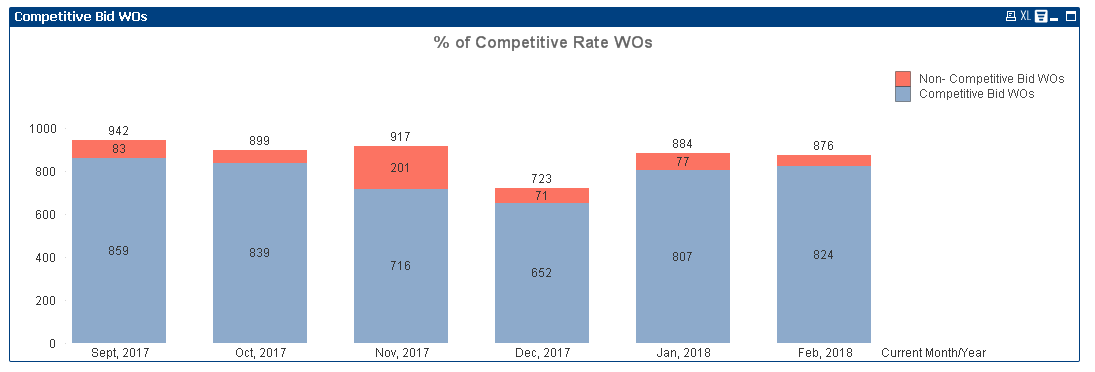
In dashboard 8 % competitive Rate wos bar chart. Is it possible to show chart like this?
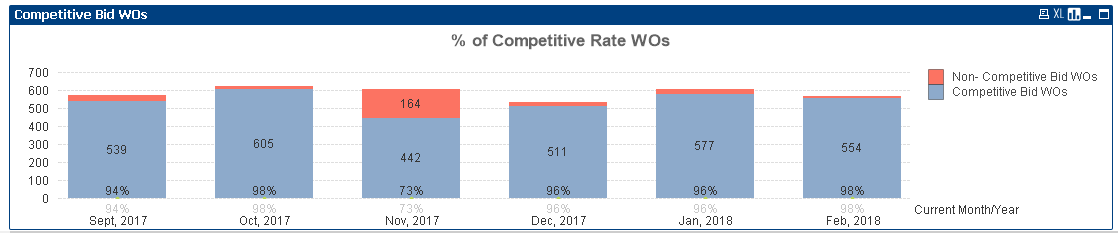
In the first bar in the qlik view chart i want 32 to be subset of 539 in the graph shown and also is it possible to display percentage as shown
formula to calculate % Competitive Rate Contractors is as below
alt((Count({<[Data Source] = {'CX Managed','Cx Managed'}, [Assignment State]= {'Effective','Effective-OnBoard'},[Comp vs Non-Comp]={'Competitive'}>}
If([Assignment Start date] >=MonthStart(Date#(Left(SubField([Current Month/Year], ',', 1), 3) & ',' & SubField([Current Month/Year], ',', 2), 'MMM, YYYY')) and [Assignment Start date] <= MonthEnd(Date#(Left(SubField([Current Month/Year], ',', 1), 3) & ',' & SubField([Current Month/Year], ',', 2), 'MMM, YYYY')), [Data Source]))/
Count({<[Data Source] = {'CX Managed','Cx Managed'}, [Assignment State]= {'Effective','Effective-OnBoard'},[Comp vs Non-Comp]={'Competitive','Not Competitive'}>}
If([Assignment Start date] >=MonthStart(Date#(Left(SubField([Current Month/Year], ',', 1), 3) & ',' & SubField([Current Month/Year], ',', 2), 'MMM, YYYY')) and [Assignment Start date] <= MonthEnd(Date#(Left(SubField([Current Month/Year], ',', 1), 3) & ',' & SubField([Current Month/Year], ',', 2), 'MMM, YYYY')), [Data Source]))),0)

Regards,
Savithri
- Mark as New
- Bookmark
- Subscribe
- Mute
- Subscribe to RSS Feed
- Permalink
- Report Inappropriate Content
Hi Savithri,
I have converted your chart to a stacked bar to get a similar view, but not showing %.
Or a mekko that is more interested in the breakdown ..

But your values are not in % format.
Regards,
Lisa
- Mark as New
- Bookmark
- Subscribe
- Mute
- Subscribe to RSS Feed
- Permalink
- Report Inappropriate Content
Hi Savithri,
Check this sample, hope this help. You can modify your expressions to achieve your requirement.
Br,
KC
KC
- Mark as New
- Bookmark
- Subscribe
- Mute
- Subscribe to RSS Feed
- Permalink
- Report Inappropriate Content
Hi Savithri,
Is it fine if you display the % on axes instead of top of the bar?
Thanks,
Pooja
- Mark as New
- Bookmark
- Subscribe
- Mute
- Subscribe to RSS Feed
- Permalink
- Report Inappropriate Content
Thank you all for your help:)