Unlock a world of possibilities! Login now and discover the exclusive benefits awaiting you.
- Qlik Community
- :
- All Forums
- :
- QlikView App Dev
- :
- Is there any option to arrange the table box in di...
- Subscribe to RSS Feed
- Mark Topic as New
- Mark Topic as Read
- Float this Topic for Current User
- Bookmark
- Subscribe
- Mute
- Printer Friendly Page
- Mark as New
- Bookmark
- Subscribe
- Mute
- Subscribe to RSS Feed
- Permalink
- Report Inappropriate Content
Is there any option to arrange the table box in different columns.
Hi All,
Is it possible to arrange the table box data in different columns instead of one column??
Thnks in Advance.
- Mark as New
- Bookmark
- Subscribe
- Mute
- Subscribe to RSS Feed
- Permalink
- Report Inappropriate Content
Hi ,
well you can but better you can share a sample with out put required instead of table we can create a Straight/Pivot Table too.
- Mark as New
- Bookmark
- Subscribe
- Mute
- Subscribe to RSS Feed
- Permalink
- Report Inappropriate Content
Hi,
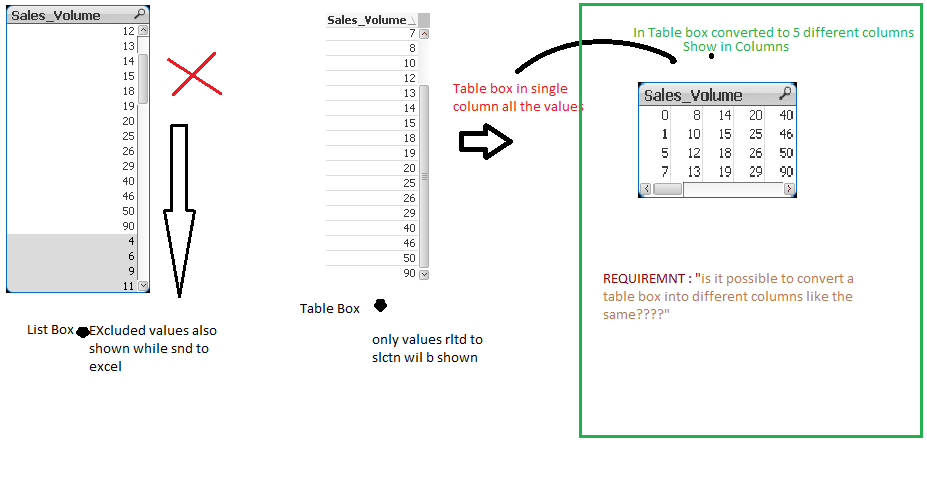
I have only one dimension in the table box, since i need to send it excel while using a List box it will show the excluded values also. But my case is like i don't want to show the excluded values. so i thought of using a Table Box. But the requirement is like {eg. if i have 50 values in the dimension wat we are taking in the Table box,it should show in 5 different columns 10 for each. is it possible.
- Mark as New
- Bookmark
- Subscribe
- Mute
- Subscribe to RSS Feed
- Permalink
- Report Inappropriate Content
perhaps a listbox with this expression can help you (hide excluded)
=aggr(only(Sales_Volume), Sales_Volume)
- Mark as New
- Bookmark
- Subscribe
- Mute
- Subscribe to RSS Feed
- Permalink
- Report Inappropriate Content
Hi,
maxgro
While using this expression the excluded values wont be visible, bt while sending to excel it is coming in one column..is it possible to export it in the same way as in the QV?? (ie..if it is in 5 columns,in excel export also it shud cme in 5 columns)
Thnks..