Unlock a world of possibilities! Login now and discover the exclusive benefits awaiting you.
- Qlik Community
- :
- All Forums
- :
- QlikView App Dev
- :
- Is there any way to make space between lines in th...
- Subscribe to RSS Feed
- Mark Topic as New
- Mark Topic as Read
- Float this Topic for Current User
- Bookmark
- Subscribe
- Mute
- Printer Friendly Page
- Mark as New
- Bookmark
- Subscribe
- Mute
- Subscribe to RSS Feed
- Permalink
- Report Inappropriate Content
Is there any way to make space between lines in the line graph?
Hi friends,
Is there any way to make space between lines in the line graph. Please can anyone suggest me as I have one line chart with three expressions. when I make values on data points the values are overlapping and it is difficult to see the values.
Thanks.
- Tags:
- new_to_qlikview
- « Previous Replies
-
- 1
- 2
- Next Replies »
- Mark as New
- Bookmark
- Subscribe
- Mute
- Subscribe to RSS Feed
- Permalink
- Report Inappropriate Content
Please see attached png and help me.
- Mark as New
- Bookmark
- Subscribe
- Mute
- Subscribe to RSS Feed
- Permalink
- Report Inappropriate Content
Don't think so it's possible..
- Mark as New
- Bookmark
- Subscribe
- Mute
- Subscribe to RSS Feed
- Permalink
- Report Inappropriate Content
If you really need to see the numbers then consider
- split the chart into 3 separate charts (you could use Trellising but it doesn't look very good.)
- show the data values in a straight table below the chart
- Mark as New
- Bookmark
- Subscribe
- Mute
- Subscribe to RSS Feed
- Permalink
- Report Inappropriate Content
You can put the data bottom of the axis
- Mark as New
- Bookmark
- Subscribe
- Mute
- Subscribe to RSS Feed
- Permalink
- Report Inappropriate Content
Does that work well with multiple lines? Dont they just all overlap then?
- Mark as New
- Bookmark
- Subscribe
- Mute
- Subscribe to RSS Feed
- Permalink
- Report Inappropriate Content
You can put one value in the graph and another in the axis.
See the image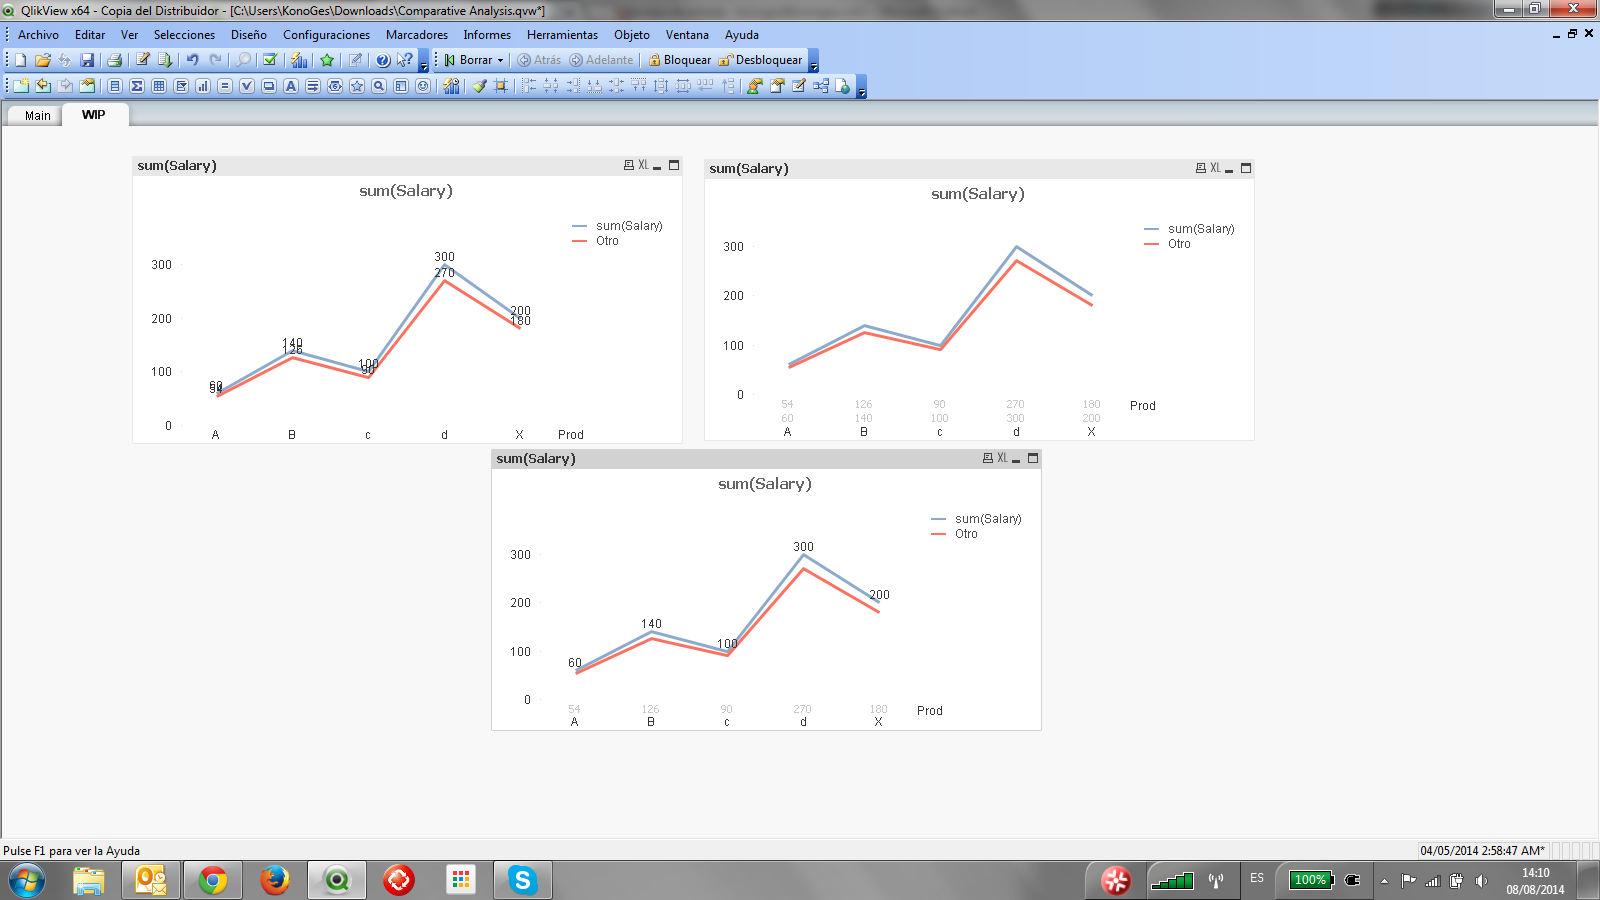
- Mark as New
- Bookmark
- Subscribe
- Mute
- Subscribe to RSS Feed
- Permalink
- Report Inappropriate Content
Hi Amelia D
If you are not particular about the visualization, then create a Cyclic group with all the 3 expressions that were used in the above chart.
- Mark as New
- Bookmark
- Subscribe
- Mute
- Subscribe to RSS Feed
- Permalink
- Report Inappropriate Content
That is ok as long as the lines stay in the same order. If the blue line dipped under the red line then the number association becomes less obvious.
- Mark as New
- Bookmark
- Subscribe
- Mute
- Subscribe to RSS Feed
- Permalink
- Report Inappropriate Content
just try un checking 'Forced 0' and checking 'Log Scale' for the expressions in the Axes of the Chart properties. See if that helps..
Regards,
Dawar
- « Previous Replies
-
- 1
- 2
- Next Replies »