Unlock a world of possibilities! Login now and discover the exclusive benefits awaiting you.
- Qlik Community
- :
- All Forums
- :
- QlikView App Dev
- :
- Issue with Bubble Chart
- Subscribe to RSS Feed
- Mark Topic as New
- Mark Topic as Read
- Float this Topic for Current User
- Bookmark
- Subscribe
- Mute
- Printer Friendly Page
- Mark as New
- Bookmark
- Subscribe
- Mute
- Subscribe to RSS Feed
- Permalink
- Report Inappropriate Content
Issue with Bubble Chart
Hi,
I have requirement for bubble chart, From attached file am facing some problems with bubble chart I want the bubble chart as like other chart(line chart).
My Issues are:1) I want display the text on top of bubble as like line chart.
2) In line chart price is showing with decimal values also(exact price) where as in bubble bubble chart it rounded up.
3) if there are two prices for one model(C-CLASS) then it will show two bubbles .
- Mark as New
- Bookmark
- Subscribe
- Mute
- Subscribe to RSS Feed
- Permalink
- Report Inappropriate Content
Hello,
For Issue 1 :
Values on Data Point
Mark this check box to have the result of an expression plotted as text on top of the data points. This option is only available for bar, line, combo and pie charts. When used for pie charts, the value will be shown next to the pie slices.
This from QV help.
For Issue 2 :
Go to Numbers tab of the chart there secect Fixedto.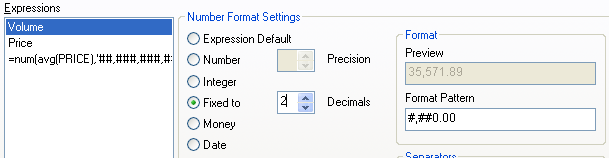
For Issue 3:
It is showing two bubbles only but overlapped.
Regards,
Yaseen
- Mark as New
- Bookmark
- Subscribe
- Mute
- Subscribe to RSS Feed
- Permalink
- Report Inappropriate Content
Hi,
Select
Labels on DataPoints option in Presentaton tab.
Regards,
Jagan.