Unlock a world of possibilities! Login now and discover the exclusive benefits awaiting you.
- Qlik Community
- :
- All Forums
- :
- QlikView App Dev
- :
- Re: Issue with pivot chart subtotal
- Subscribe to RSS Feed
- Mark Topic as New
- Mark Topic as Read
- Float this Topic for Current User
- Bookmark
- Subscribe
- Mute
- Printer Friendly Page
- Mark as New
- Bookmark
- Subscribe
- Mute
- Subscribe to RSS Feed
- Permalink
- Report Inappropriate Content
Issue with pivot chart subtotal
Hi all,
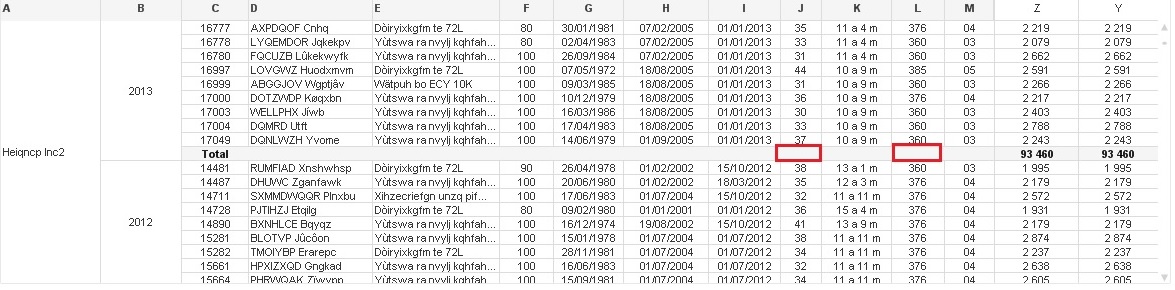
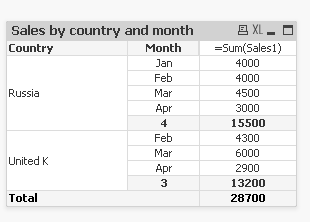
I'am facing an issue with subtotal. I have a pivot chart with 13 dimensions and 2 expressions (Z, Y). I'd like display in sub total for dimensions J and L a sum or avg. (first snaphot below)
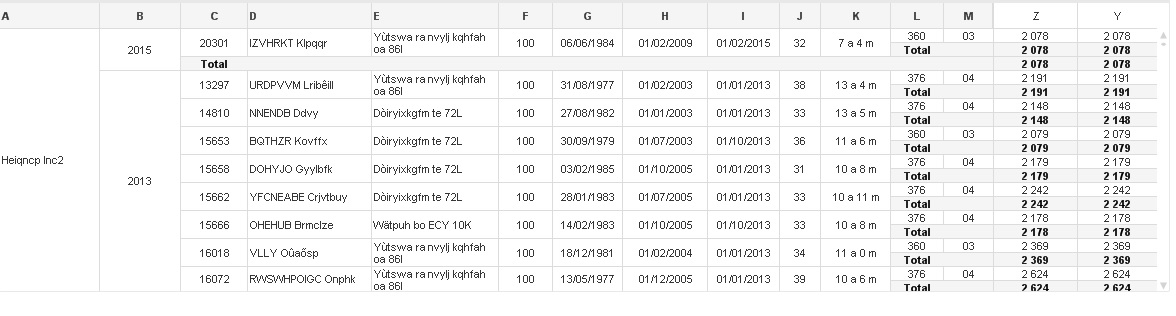
I manage to display this only if i tick the "Show partial sum" for J and L. But the formatting pivot has changed.(see second snapshot below) .
So i want only subtotal for dimensions A and B, but display formula for dimensions J and L. Is there a way to achive this without having to put J and L in expressions.
Regards
- « Previous Replies
-
- 1
- 2
- Next Replies »
- Mark as New
- Bookmark
- Subscribe
- Mute
- Subscribe to RSS Feed
- Permalink
- Report Inappropriate Content
Don't works, return 4 like with just =Count(Distinct Month)
- Mark as New
- Bookmark
- Subscribe
- Mute
- Subscribe to RSS Feed
- Permalink
- Report Inappropriate Content
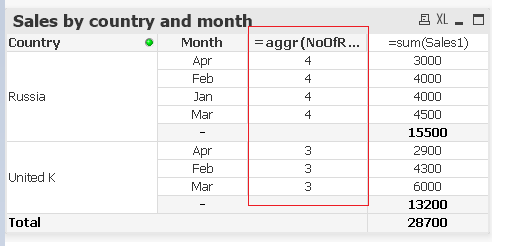
I manage to get 4 and 3 in calculated dimension with =aggr(NoOfRows(),Country,Month). But can't get it in subtotal...
Please stalwar1 help us !!
- Mark as New
- Bookmark
- Subscribe
- Mute
- Subscribe to RSS Feed
- Permalink
- Report Inappropriate Content
Subtotal can only show a single value (mostly used to show the text 'Total'), but you might be able to play around using the Pick(Dim(...)) technique or play around with this Partial Sums in straight table | Custom Labels in Pivot SubTotals
- Mark as New
- Bookmark
- Subscribe
- Mute
- Subscribe to RSS Feed
- Permalink
- Report Inappropriate Content
Thanks for your reply. Can't understand how pick function can be helpful but in order to get a single value in subtotal, i use min and max with =min(aggr(NoOfRows(),Country,Month))
=max(aggr(NoOfRows(),Country,Month))
I have value for Russia in one chart (4) and value for UK (3) in an other but can't get in the same chart.
- Mark as New
- Bookmark
- Subscribe
- Mute
- Subscribe to RSS Feed
- Permalink
- Report Inappropriate Content
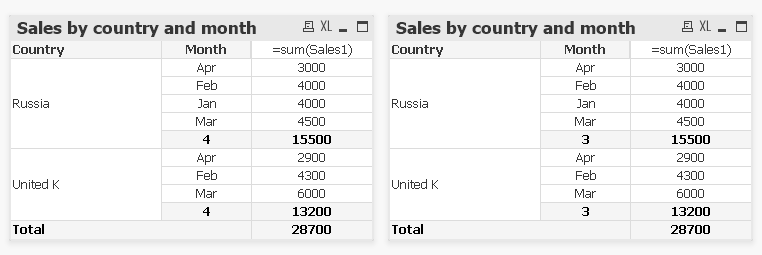
This is what I implied
- Mark as New
- Bookmark
- Subscribe
- Mute
- Subscribe to RSS Feed
- Permalink
- Report Inappropriate Content
Pick with ISLAND Dim table load helped me in few situations like a charm. Thanks very much Sunny for this trick.
- Mark as New
- Bookmark
- Subscribe
- Mute
- Subscribe to RSS Feed
- Permalink
- Report Inappropriate Content
Thanks a lot for your help and for this useful trick!!
- « Previous Replies
-
- 1
- 2
- Next Replies »