Unlock a world of possibilities! Login now and discover the exclusive benefits awaiting you.
- Qlik Community
- :
- All Forums
- :
- QlikView App Dev
- :
- Issues with Histogram
- Subscribe to RSS Feed
- Mark Topic as New
- Mark Topic as Read
- Float this Topic for Current User
- Bookmark
- Subscribe
- Mute
- Printer Friendly Page
- Mark as New
- Bookmark
- Subscribe
- Mute
- Subscribe to RSS Feed
- Permalink
- Report Inappropriate Content
Issues with Histogram
I have created a histogram using the following dimension:
=AGGR(CLASS(AVG({1<GEN={'ALL'}>} AP_Weighted),BinWidth),ID,SET,SUBSET)
and expression:
COUNT(DISTINCT ID)
'BinWidth' is a variable defined by a user input box.
I then have an exact copy of the histogram (same dimension/expression) displaying as a straight table.
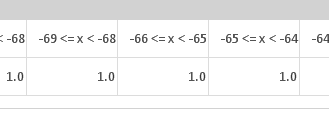
When I select a column in the table, e.g. -66<=x>-65, a list box of 'ID' shows me then 1 ID that has that 'AP_Weighted' value.
This all works as I want/expect.
However, I have another field call 'Rel_Success', which I have copied into the exact same expression, so:
=AGGR(CLASS(AVG({1<GEN={'ALL'}>} Rel_Success),BinWidth),ID,SET,SUBSET)
and whilst the chart and table display correctly, selecting a column in the table doesn't work! Instead, it selects lots of the 'SET' and 'SUBSET' values in other list boxes.
Why are the two fields working so differently, and how can I fix this?? They are loaded in the script in the exact same way, so I just can't see a reason for the difference in behaviour...