Unlock a world of possibilities! Login now and discover the exclusive benefits awaiting you.
- Qlik Community
- :
- All Forums
- :
- QlikView App Dev
- :
- Joining Graphs
- Subscribe to RSS Feed
- Mark Topic as New
- Mark Topic as Read
- Float this Topic for Current User
- Bookmark
- Subscribe
- Mute
- Printer Friendly Page
- Mark as New
- Bookmark
- Subscribe
- Mute
- Subscribe to RSS Feed
- Permalink
- Report Inappropriate Content
Joining Graphs
Hello,
I'm having a problem when I try to join two graphs.
I'm using as dimension in A: month_created and in B: month_resolved,
And the same expression in both: count(qtd)
A B
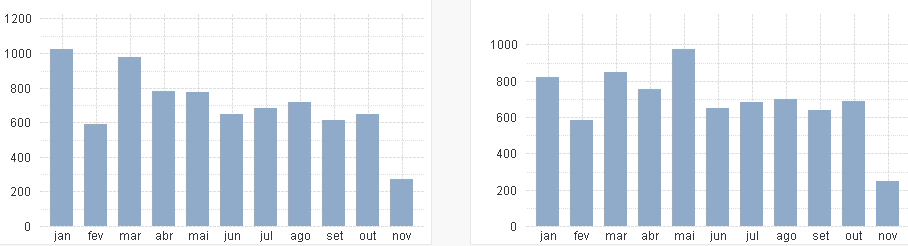
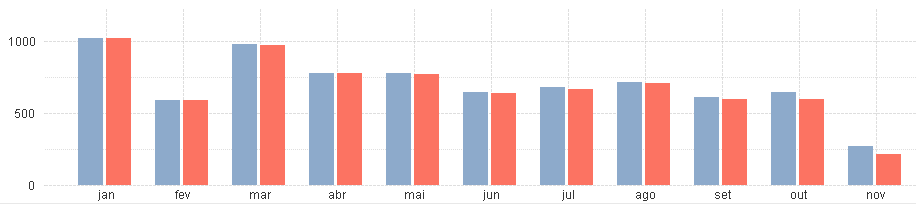
The Qlikview is generating this graph:
Someone has an idea how to fix it?
Thanks
Accepted Solutions
- Mark as New
- Bookmark
- Subscribe
- Mute
- Subscribe to RSS Feed
- Permalink
- Report Inappropriate Content
do as :
1. Rename the two diffrent months that is month_created and month_resolved as month
Table1:
month_resolved as Month,
qtd as qtd_resolved
table2:
month_created as Month,
qtd as qtd_created,
join both two tables to common calendar hope you know it how to create a calendar and connect individula tables by Date field.
then add the Month field to graph and use two diffrent expression count(qtd_resolved) and count(qtd_created).
regards,
anant
- Mark as New
- Bookmark
- Subscribe
- Mute
- Subscribe to RSS Feed
- Permalink
- Report Inappropriate Content
use two expressions in one multichart