Unlock a world of possibilities! Login now and discover the exclusive benefits awaiting you.
- Qlik Community
- :
- All Forums
- :
- QlikView App Dev
- :
- LINE
- Subscribe to RSS Feed
- Mark Topic as New
- Mark Topic as Read
- Float this Topic for Current User
- Bookmark
- Subscribe
- Mute
- Printer Friendly Page
- Mark as New
- Bookmark
- Subscribe
- Mute
- Subscribe to RSS Feed
- Permalink
- Report Inappropriate Content
LINE
Hi,
I have following Pivot table in my QV document
| CLASS | YEAR | 0 | 1 | 2 |
| A | 2011 | 10,000 | 20,000 | 5,000 |
| A | 2012 | 10,000 | 20,000 | 5,000 |
| A | 2013 | 10,000 | 20,000 | 5,000 |
| A | 2014 | 10,000 | 20,000 | 5,000 |
| A | 2015 | 10,000 | 20,000 | 5,000 |
| B | 2011 | 10,000 | 20,000 | 5,000 |
| B | 2012 | 10,000 | 20,000 | 5,000 |
| B | 2013 | 10,000 | 20,000 | 5,000 |
| B | 2014 | 10,000 | 20,000 | 5,000 |
| B | 2015 | 10,000 | 20,000 | 5,000 |
| C | 2011 | 10,000 | 20,000 | 5,000 |
| C | 2012 | 10,000 | 20,000 | 5,000 |
| C | 2013 | 10,000 | 20,000 | 5,000 |
| C | 2014 | 10,000 | 20,000 | 5,000 |
| C | 2015 | 10,000 | 20,000 | 5,000 |
I want to make the 2015 bold and draw a line in between two classes. Pls help me.
Accepted Solutions
- Mark as New
- Bookmark
- Subscribe
- Mute
- Subscribe to RSS Feed
- Permalink
- Report Inappropriate Content
You need to add condition like below in all dimensions and expressions.
=if(Year = '2015', '<B><U>')
- Mark as New
- Bookmark
- Subscribe
- Mute
- Subscribe to RSS Feed
- Permalink
- Report Inappropriate Content
Hi,
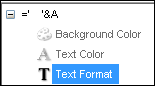
In your pivot expression and Dimension -> Text Format ->
=if(mod(RowNo(total),5)=0,'<B>')
Hope this Helps,
Hirish
- Mark as New
- Bookmark
- Subscribe
- Mute
- Subscribe to RSS Feed
- Permalink
- Report Inappropriate Content
You need to add condition like below in all dimensions and expressions.
=if(Year = '2015', '<B><U>')
- Mark as New
- Bookmark
- Subscribe
- Mute
- Subscribe to RSS Feed
- Permalink
- Report Inappropriate Content
Properties -> Expression -> Expand the + sign of Expression -> Text Format -> write the desired condition -> Use formats like <b> etc...
Share a sample app if possible?
- Mark as New
- Bookmark
- Subscribe
- Mute
- Subscribe to RSS Feed
- Permalink
- Report Inappropriate Content
Thanks
Is there a any way drawing a single line below the year 2015
- Mark as New
- Bookmark
- Subscribe
- Mute
- Subscribe to RSS Feed
- Permalink
- Report Inappropriate Content
You meant single line for the whole row.? Sorry, I guess it's not possible. Instead, you can use some colors.