Unlock a world of possibilities! Login now and discover the exclusive benefits awaiting you.
- Qlik Community
- :
- All Forums
- :
- QlikView App Dev
- :
- LINECHART
- Subscribe to RSS Feed
- Mark Topic as New
- Mark Topic as Read
- Float this Topic for Current User
- Bookmark
- Subscribe
- Mute
- Printer Friendly Page
- Mark as New
- Bookmark
- Subscribe
- Mute
- Subscribe to RSS Feed
- Permalink
- Report Inappropriate Content
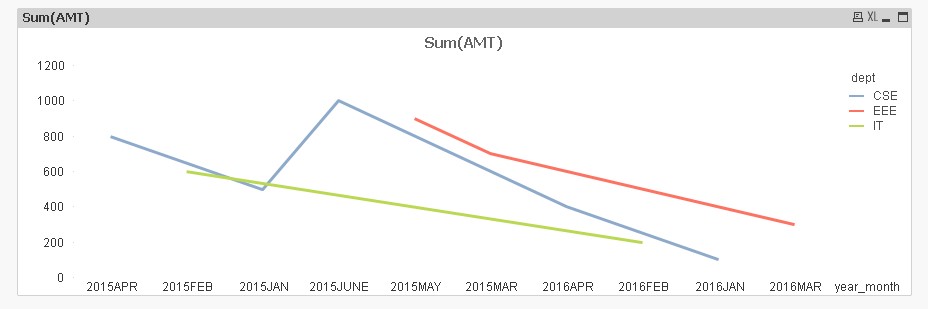
LINECHART
| year | month | dept | AMT |
| 2016 | JAN | CSE | 100 |
| 2016 | FEB | IT | 200 |
| 2016 | MAR | EEE | 300 |
| 2016 | APR | CSE | 400 |
| 2015 | JAN | CSE | 500 |
| 2015 | FEB | IT | 600 |
| 2015 | MAR | EEE | 700 |
| 2015 | APR | CSE | 800 |
| 2015 | MAY | EEE | 900 |
| 2015 | JUNE | CSE | 1000 |
Hi all
above is my data, i need line chart for the total incoming spend amt by dept, for the year and month.
so can i achieve this chart? which will come for dimension and expression
- Mark as New
- Bookmark
- Subscribe
- Mute
- Subscribe to RSS Feed
- Permalink
- Report Inappropriate Content
List Box Items:
Year
Month
Dimension:
dept
Measure:
sum(AMT)
- Mark as New
- Bookmark
- Subscribe
- Mute
- Subscribe to RSS Feed
- Permalink
- Report Inappropriate Content
can u send me in anqvw file
- Mark as New
- Bookmark
- Subscribe
- Mute
- Subscribe to RSS Feed
- Permalink
- Report Inappropriate Content
LOAD year,
     month,
     year &  month as year_month,
     dept,
     AMT
FROM
[https://community.qlik.com/thread/224067]
(html, codepage is 1257, embedded labels, table is @1);
Result:
- Mark as New
- Bookmark
- Subscribe
- Mute
- Subscribe to RSS Feed
- Permalink
- Report Inappropriate Content
Also, in my opinion you will have to make a Master Calendar to succeed for aim.
- Mark as New
- Bookmark
- Subscribe
- Mute
- Subscribe to RSS Feed
- Permalink
- Report Inappropriate Content
See Attached.
The best way to learn on qlik is to give it a go!
Regards,
- Mark as New
- Bookmark
- Subscribe
- Mute
- Subscribe to RSS Feed
- Permalink
- Report Inappropriate Content
in line chart how many dimension are accepted? till 2 dimensions?
- Mark as New
- Bookmark
- Subscribe
- Mute
- Subscribe to RSS Feed
- Permalink
- Report Inappropriate Content
As many as you require your analysis to cover or is visually and analytically intuitive.
- Mark as New
- Bookmark
- Subscribe
- Mute
- Subscribe to RSS Feed
- Permalink
- Report Inappropriate Content
in line chart i need center line of vertical, this can be achieved?