Unlock a world of possibilities! Login now and discover the exclusive benefits awaiting you.
- Qlik Community
- :
- All Forums
- :
- QlikView App Dev
- :
- Limiting Count.
- Subscribe to RSS Feed
- Mark Topic as New
- Mark Topic as Read
- Float this Topic for Current User
- Bookmark
- Subscribe
- Mute
- Printer Friendly Page
- Mark as New
- Bookmark
- Subscribe
- Mute
- Subscribe to RSS Feed
- Permalink
- Report Inappropriate Content
Limiting Count.
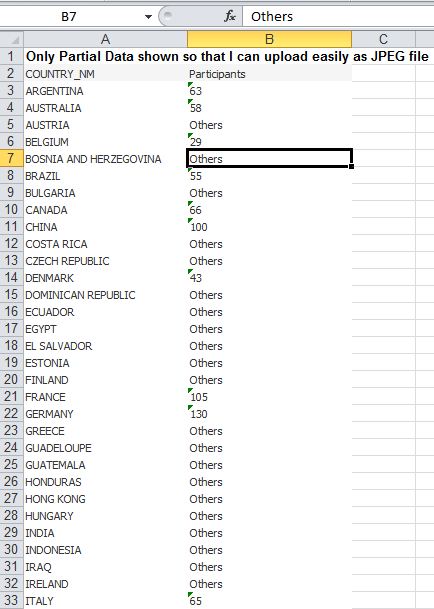
I have the following fields,Participant ID, Country and Month. I want to find total number of participants per country.
Using the following Definition ( Count (DISTINCT PARTICIPANT_ID) ) I could able to extract relevant information. My problem is in certain countries we have only 1 or 2 particpants. In certain countries we have more than 1000 participants. I want to extract only > 25 participants in chart and anything <25 should be summarised under Others.
How do I implement this? (Attached file contains teh data, Country, Participants) It is difficult to see as we have more countries.
Thanks
- Tags:
- new_to_qlikview
- Mark as New
- Bookmark
- Subscribe
- Mute
- Subscribe to RSS Feed
- Permalink
- Report Inappropriate Content
Hi,
I'd try the following as an expression
Count({< PARTICIPANT_ID = {"=Count(DISTINCT PARTICIPANT_ID) > 25"} >} DISTINCT PARTICIPANT_ID)
And even better creating this accumulation in the script using Peek() and Previous() as a flag field, (with values 1 if greater than 25 or 0 if less), so although the load time would be a bit slower, the chart rendering will do faster. Check this thread among several others on how to create accumulations in the script using those functions.
Hope that helps.
BI Consultant
- Mark as New
- Bookmark
- Subscribe
- Mute
- Subscribe to RSS Feed
- Permalink
- Report Inappropriate Content
Hi,
I suggest you have to use the condition in expression like
Count(If( Count (Distinct PARTICIPANT_ID) ) > 25, Count (Distinct PARTICIPANT_ID) ) ) )
this will show only > 25 participants like ways
Count(If( Count (Distinct PARTICIPANT_ID) ) < 25, Count (Distinct PARTICIPANT_ID) ) ) )
this will show only < 25 participants like ways
Rgds
Anand
- Mark as New
- Bookmark
- Subscribe
- Mute
- Subscribe to RSS Feed
- Permalink
- Report Inappropriate Content
Hi there,
Going even further, and although I don't recommend you to do this way because of the presumable poor performance of calculated dimensions, you could leave the expression as it is, but use the following as dimension in the chart
If(Aggr(Count(DISTINCT PARTICIPANT_ID), PARTICIPANT_ID) > 25, PARTICIPANT_ID, 'Others')
Check syntax, I may have missed some parentheses.
Hope that helps.
BI Consultant
- Mark as New
- Bookmark
- Subscribe
- Mute
- Subscribe to RSS Feed
- Permalink
- Report Inappropriate Content
Hi,
You can use it another ways also by aggregating the data like
Count(If( Count (Distinct PARTICIPANT_ID) ) > 25, Aggr( Count (Distinct PARTICIPANT_ID),PARTICIPANT_ID) ) ) )
this will show only > 25 participants like ways
Count(If( Count (Distinct PARTICIPANT_ID) ) < 25, Aggr( Count (Distinct PARTICIPANT_ID),PARTICIPANT_ID) ) ) )
this will show only < 25 participants like ways
Rgds
Anand
- Mark as New
- Bookmark
- Subscribe
- Mute
- Subscribe to RSS Feed
- Permalink
- Report Inappropriate Content
Thanks for the help
If I change the Definition
From: Count (DISTINCT PARTICIPANT_ID)
To: If(Count(Distinct PARTICIPANT_ID) >=25, Count ( DISTINCT PARTICIPANT_ID))
I am getting the Graph but it is not summerised under Others.
Please refer to the below Image fb1.JPG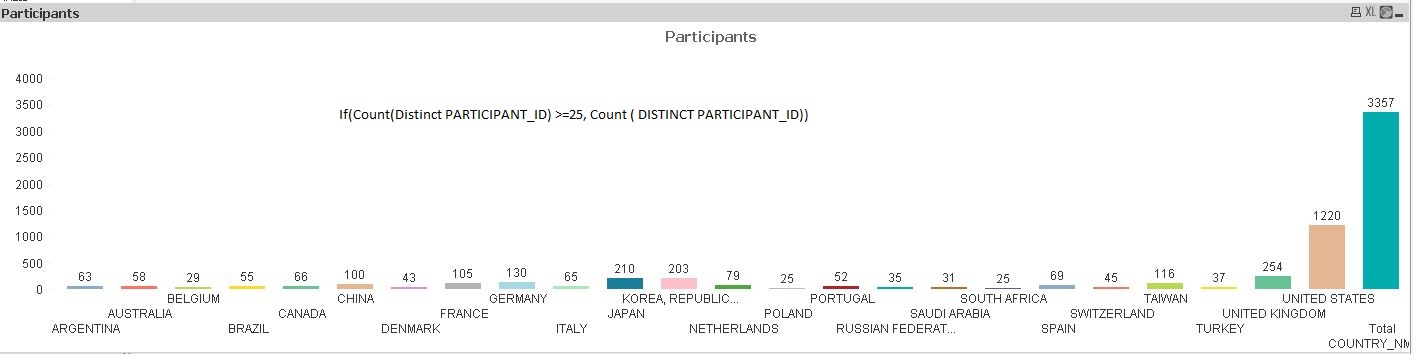
If change this to
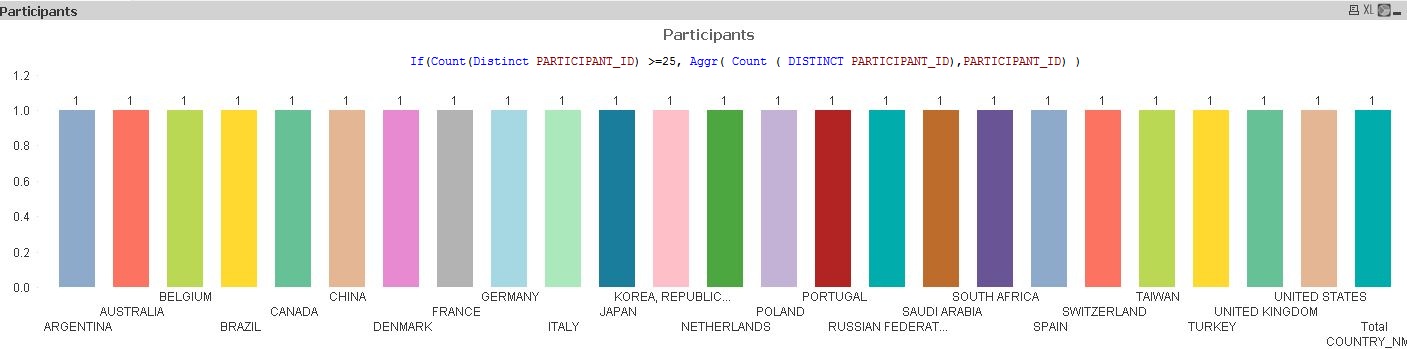
If(Count(Distinct PARTICIPANT_ID) >=25, Aggr( Count ( DISTINCT PARTICIPANT_ID),PARTICIPANT_ID) )
or
Aggr(Count(DISTINCT PARTICIPANT_ID), PARTICIPANT_ID)
I am getting Graph similar to below. except in Aggr(Count(DISTINCT PARTICIPANT_ID), PARTICIPANT_ID) I am getting all countries.
If I use
Count({< PARTICIPANT_ID = {"=Count(DISTINCT PARTICIPANT_ID) > 25"} >} DISTINCT PARTICIPANT_ID)
I am getting answer no data to display.
if I use
If(Count(Distinct PARTICIPANT_ID) >=25, Count ( DISTINCT PARTICIPANT_ID), 'Others')
I think we should modify the folloing
If(Count(Distinct PARTICIPANT_ID) >=25, Count ( DISTINCT PARTICIPANT_ID))
to add additional Row 'Others' and it should be incremented in condition is met. How should I implement?
Thanks