Unlock a world of possibilities! Login now and discover the exclusive benefits awaiting you.
- Qlik Community
- :
- All Forums
- :
- QlikView App Dev
- :
- Line Area Chart in Qlik Sense and QlikView are not...
- Subscribe to RSS Feed
- Mark Topic as New
- Mark Topic as Read
- Float this Topic for Current User
- Bookmark
- Subscribe
- Mute
- Printer Friendly Page
- Mark as New
- Bookmark
- Subscribe
- Mute
- Subscribe to RSS Feed
- Permalink
- Report Inappropriate Content
Line Area Chart in Qlik Sense and QlikView are not providing same results with same formula
Hi,
I'm developing a PoC to Showcase Tableau LoD capability in QlikSense
Top 15 Tableau LOD Expressions (Practical Examples)
I've same data set and almost same scripting between Qlik Sense and Qlikview.
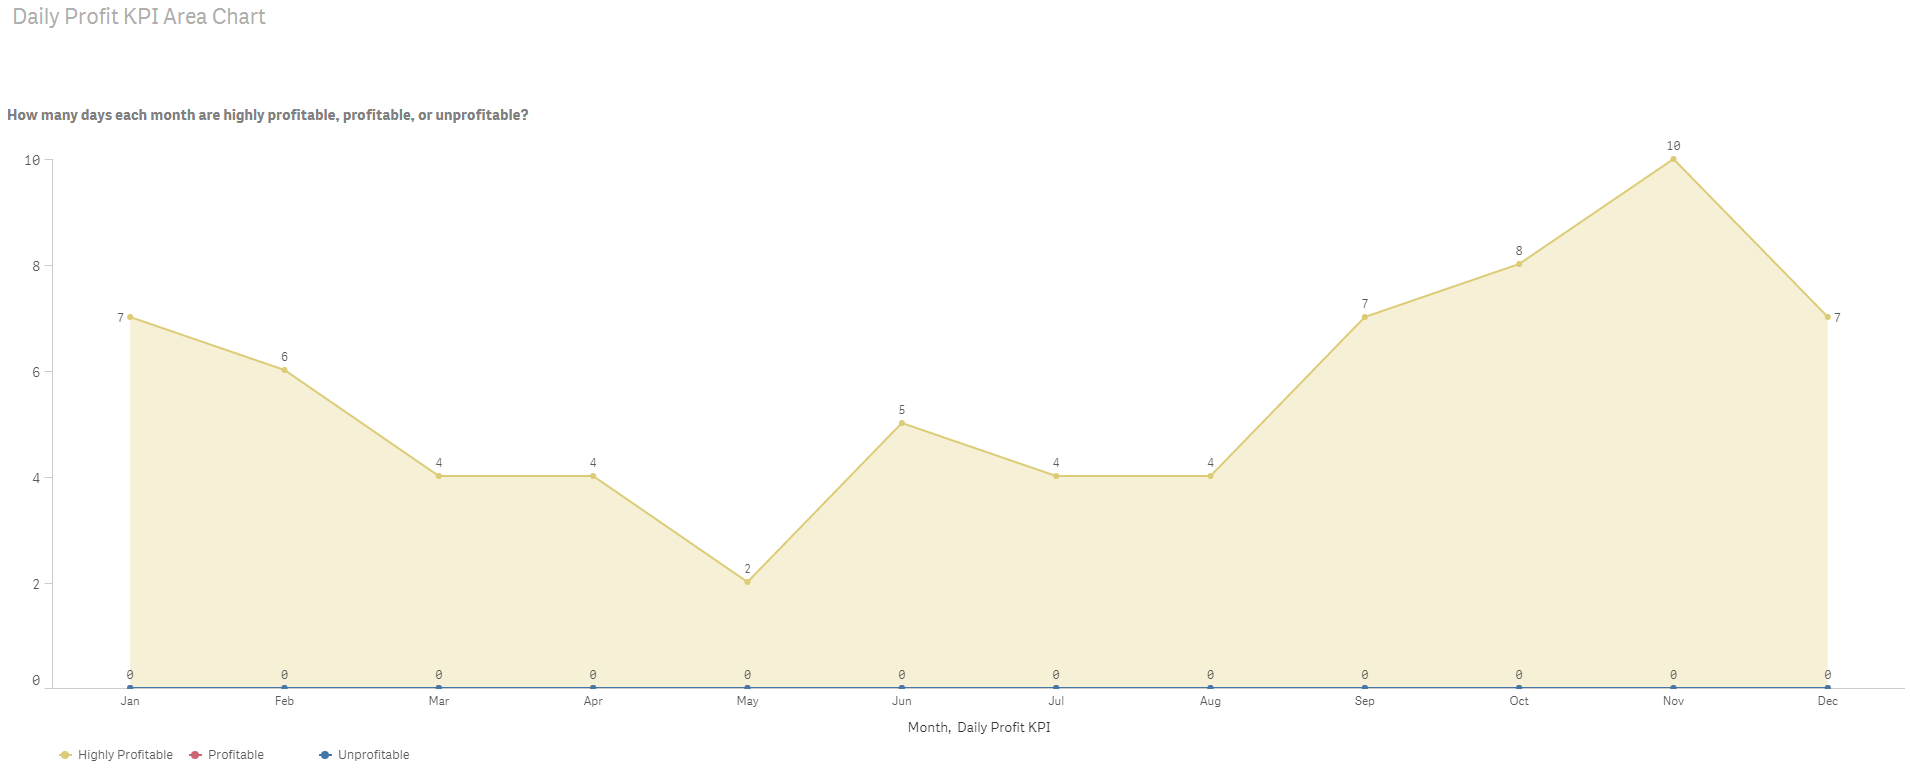
In Qlikview I've Set Analysis expression provides me same results as seen in Tableau LoD for Daily Profit KPI example.
Same expression in Qlik Sense is not working. I'm getting line chart using a different expression but not able to understand why same expression and with same dimension as in Qlikview will not work in Qlik Sense.
Any guidance will be very helpful.
Also what I need to do to get individual chart as seen in Tableau or Qlikview sample that I've attached here.
BR,
Vijay
Accepted Solutions
- Mark as New
- Bookmark
- Subscribe
- Mute
- Subscribe to RSS Feed
- Permalink
- Report Inappropriate Content
This expression seems to work (with double quotes instead of single quotes
Count({<[Daily Profit KPI] = {"Highly Profitable"}, [Order Year] = {'2010'}, [Order Date]>} [Daily Profit KPI])
- Mark as New
- Bookmark
- Subscribe
- Mute
- Subscribe to RSS Feed
- Permalink
- Report Inappropriate Content
This expression seems to work (with double quotes instead of single quotes
Count({<[Daily Profit KPI] = {"Highly Profitable"}, [Order Year] = {'2010'}, [Order Date]>} [Daily Profit KPI])
- Mark as New
- Bookmark
- Subscribe
- Mute
- Subscribe to RSS Feed
- Permalink
- Report Inappropriate Content
Hi Sunny,
Yes. That is the solution.
In set analysis if single quotes are not working then give a try with double quotes.
BR,
Vijay