Unlock a world of possibilities! Login now and discover the exclusive benefits awaiting you.
Announcements
FLASH SALE: Save $500! Use code FLASH2026 at checkout until Feb 14th at 11:59PM ET. Register Now!
- Qlik Community
- :
- All Forums
- :
- QlikView App Dev
- :
- Line Chart Expression
Options
- Subscribe to RSS Feed
- Mark Topic as New
- Mark Topic as Read
- Float this Topic for Current User
- Bookmark
- Subscribe
- Mute
- Printer Friendly Page
Turn on suggestions
Auto-suggest helps you quickly narrow down your search results by suggesting possible matches as you type.
Showing results for
Anonymous
Not applicable
2016-04-25
04:57 AM
- Mark as New
- Bookmark
- Subscribe
- Mute
- Subscribe to RSS Feed
- Permalink
- Report Inappropriate Content
Line Chart Expression
Hi All,
I have a line chart the maximum value on Y axis ie Expression is 100% but the axis shows till 104 % can I restrict to show only till 100.
104 % |
|
102% |
|
100% |
|
98% |
448 Views
2 Replies
MVP
2016-04-25
04:58 AM
- Mark as New
- Bookmark
- Subscribe
- Mute
- Subscribe to RSS Feed
- Permalink
- Report Inappropriate Content
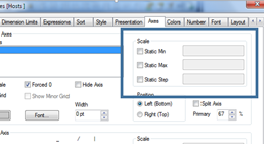
Go to axes tab
Tick Static Max and write 1 in expression
Not applicable
2016-04-25
05:40 AM
Author
- Mark as New
- Bookmark
- Subscribe
- Mute
- Subscribe to RSS Feed
- Permalink
- Report Inappropriate Content
Hi Manoj,
Go to the chart properties => Axes Tab => in the scale option,
Check the checkbox static Max and put 1 in the space provided.
Regards,
Anjali Gupta