Unlock a world of possibilities! Login now and discover the exclusive benefits awaiting you.
- Qlik Community
- :
- All Forums
- :
- QlikView App Dev
- :
- Line Chart - Non continuous Value
- Subscribe to RSS Feed
- Mark Topic as New
- Mark Topic as Read
- Float this Topic for Current User
- Bookmark
- Subscribe
- Mute
- Printer Friendly Page
- Mark as New
- Bookmark
- Subscribe
- Mute
- Subscribe to RSS Feed
- Permalink
- Report Inappropriate Content
Line Chart - Non continuous Value
Hi All,
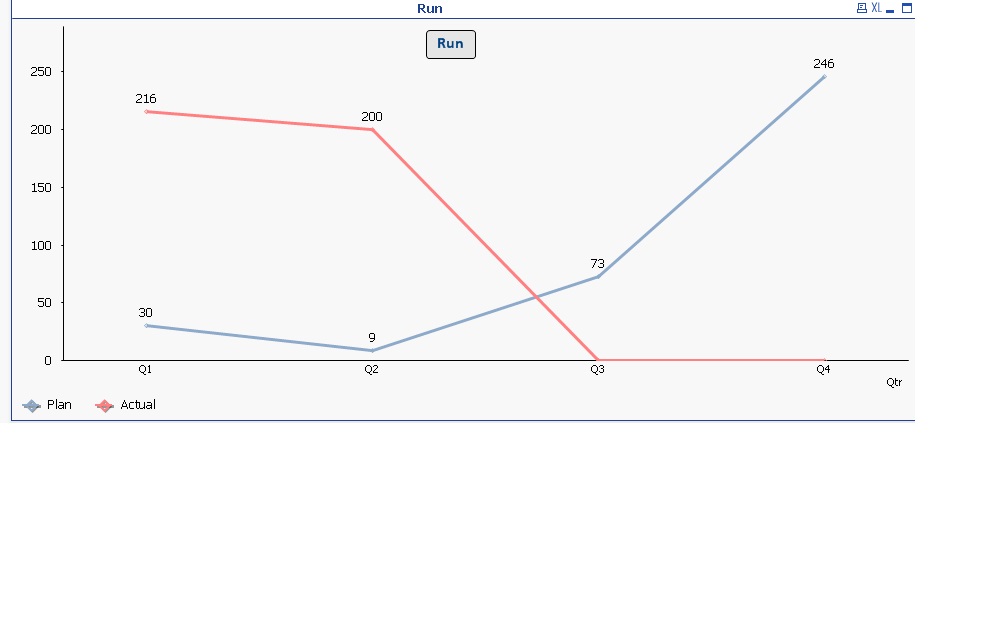
Need your help. I want to create a Line chart for Plan and Actual, but my trend line should stop where the value is "0" or in this case its "null". Please see below chart, the Actual line(in red) should stop at Q2(200) as the other values are 0 in the quarter. Am attaching the excel from which the chart is created. Is it possible in QlikView?
Dimesion used in Chart:- Qtr_GraphFlag
Expression used in chart:- =sum(if(GraphStatus='Run',GraphPlan)) -- Blue line
=sum(if(GraphStatus='Run',GraphActual)) -- Red Line
Accepted Solutions
- Mark as New
- Bookmark
- Subscribe
- Mute
- Subscribe to RSS Feed
- Permalink
- Report Inappropriate Content
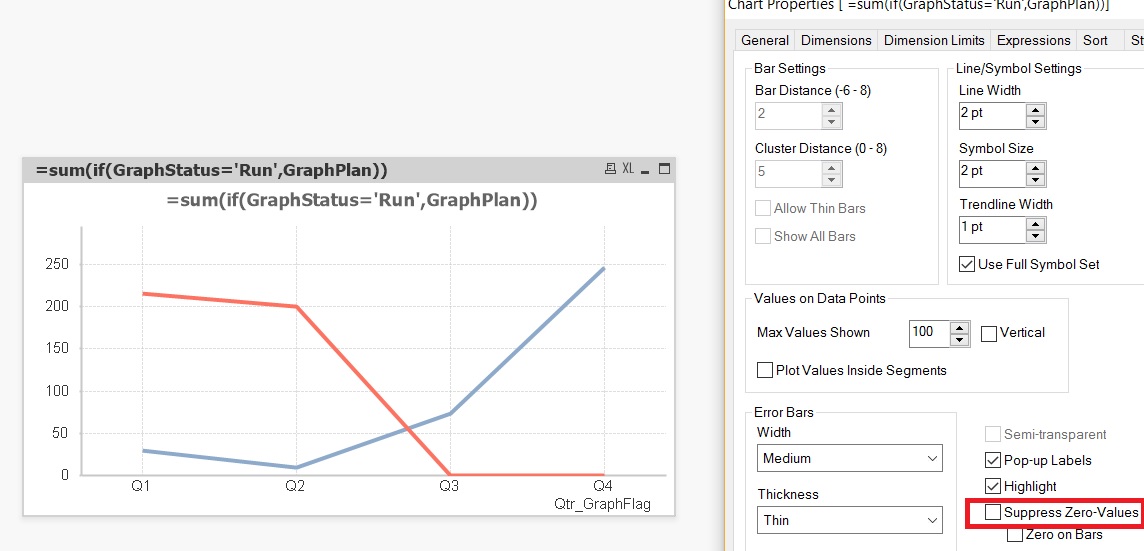
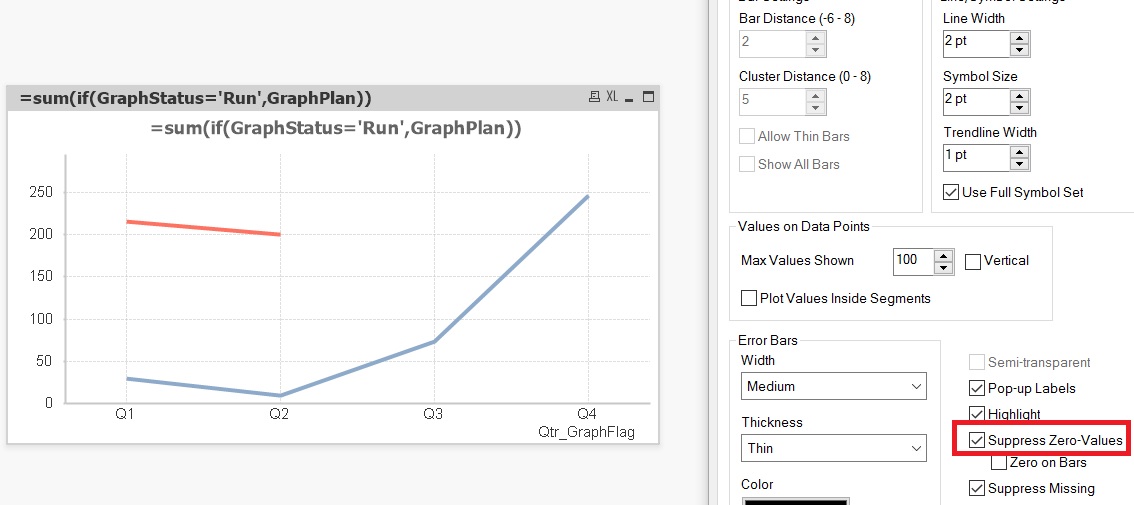
Try supress zero value in Presentation tab. Is that you are trying to achieve?
- Mark as New
- Bookmark
- Subscribe
- Mute
- Subscribe to RSS Feed
- Permalink
- Report Inappropriate Content
Check this? Using Line Chart.
Dim:
Qtr_GraphFlag
Expr:
Plan: = Sum({< GraphStatus = {'Run'} >}GraphPlan)
Actual: = Sum({< GraphStatus = {'Run'} >}GraphActual)
- Mark as New
- Bookmark
- Subscribe
- Mute
- Subscribe to RSS Feed
- Permalink
- Report Inappropriate Content
Try supress zero value in Presentation tab. Is that you are trying to achieve?