Unlock a world of possibilities! Login now and discover the exclusive benefits awaiting you.
- Qlik Community
- :
- All Forums
- :
- QlikView App Dev
- :
- Line Chart Trellis feature
- Subscribe to RSS Feed
- Mark Topic as New
- Mark Topic as Read
- Float this Topic for Current User
- Bookmark
- Subscribe
- Mute
- Printer Friendly Page
- Mark as New
- Bookmark
- Subscribe
- Mute
- Subscribe to RSS Feed
- Permalink
- Report Inappropriate Content
Line Chart Trellis feature
I would like to combine dimensions from two different line charts and represent them in a single line chart, with two dimensions on Y axis. I have attached the file with charts here.
Please see the attached pictures of Line Charts representing temperature and pressure of two machines (recognized by serial numbers) separately at two positions. Can we represent both temperature and pressure on the same line chart for both positions and machines?
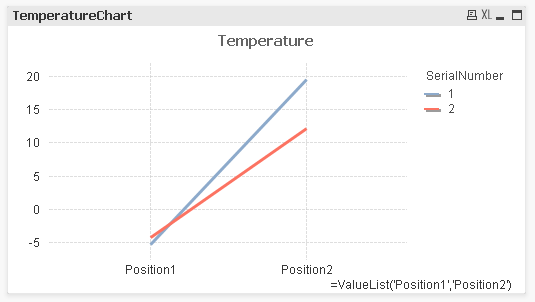
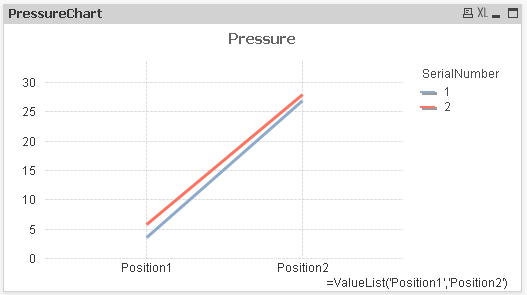
I used Trellis feature of chart, but got struck in a problem that the Y-axis range for temperature and pressure in the cobined chart should be same. I want to have different Y-axis ranges for temperature and pressure in the combined chart.
Please help... Thanks...!!!!
- Tags:
- new_to_qlikview