Unlock a world of possibilities! Login now and discover the exclusive benefits awaiting you.
- Qlik Community
- :
- All Forums
- :
- QlikView App Dev
- :
- Line Chart: missing data on axis
- Subscribe to RSS Feed
- Mark Topic as New
- Mark Topic as Read
- Float this Topic for Current User
- Bookmark
- Subscribe
- Mute
- Printer Friendly Page
- Mark as New
- Bookmark
- Subscribe
- Mute
- Subscribe to RSS Feed
- Permalink
- Report Inappropriate Content
Line Chart: missing data on axis
Hi @all,
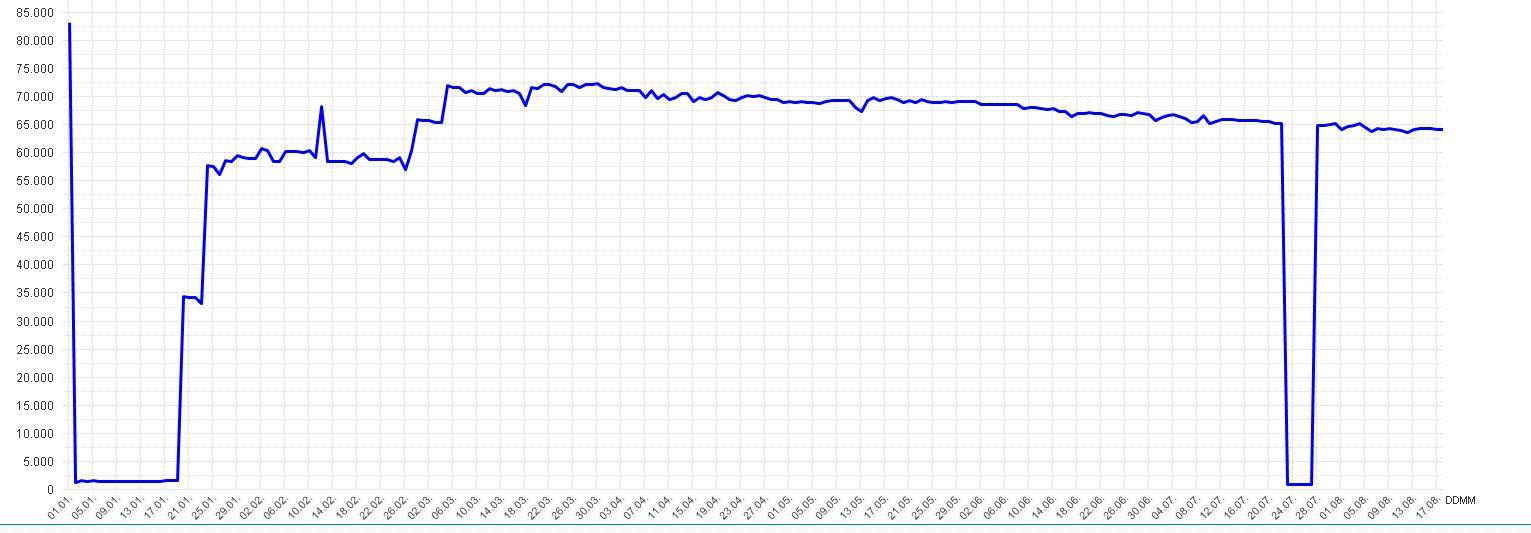
in my screenshot you can see, that there are missing data on the x axis (DDMM: Day and Month).
I filter for year 2014 and nothing else. I am absolutly sure, that there are data an each day of the day!
Show NULL values is everywhere activated. Maybe the width of the diagram is to small? But i dont think this could be the solution, because many users working with a low resolution.
Has anybody an idea how to show data to 31.12.?
Thanks and regards,
Sabrina
- Mark as New
- Bookmark
- Subscribe
- Mute
- Subscribe to RSS Feed
- Permalink
- Report Inappropriate Content
Hi
Please try this:
Chart properties -> Presentation -> check Enable X-axis scrollbar -> when number of items exceeds (e.g.) 30. You'll then see a scrollbar on the X-axis, and I think you'll see all your data.
Regards
- Mark as New
- Bookmark
- Subscribe
- Mute
- Subscribe to RSS Feed
- Permalink
- Report Inappropriate Content
Hi Britt,
thank you for your support!
I tried this out. The scroll bar appears, but when the number of items exceeds to 25 or 30 (or ...) all days of the month will not shown correctly (see my screenshot).
Is it possible to minimize the distance between the values on x axis?
Regards,
Sabrina

- Mark as New
- Bookmark
- Subscribe
- Mute
- Subscribe to RSS Feed
- Permalink
- Report Inappropriate Content
Hi Sabrina
What is exactly the problem? I can see almost all days of the month, all other days are at the right of the horizontal scroll bar. In a line chart, it's not possible to to minimize the distance between the values on the X-axis.
Regards
Britt
- Mark as New
- Bookmark
- Subscribe
- Mute
- Subscribe to RSS Feed
- Permalink
- Report Inappropriate Content
Hi,
the problem ist: my customer dont want a scroll bar, but want to see all days of the month 😞
Thank you!!!
- Mark as New
- Bookmark
- Subscribe
- Mute
- Subscribe to RSS Feed
- Permalink
- Report Inappropriate Content
I don't think it's possible without a scrollbar. Or maybe you can make your chart bigger. Maybe someone else has an idea?