Unlock a world of possibilities! Login now and discover the exclusive benefits awaiting you.
- Qlik Community
- :
- All Forums
- :
- QlikView App Dev
- :
- Line Chart with Label inside the plot area
- Subscribe to RSS Feed
- Mark Topic as New
- Mark Topic as Read
- Float this Topic for Current User
- Bookmark
- Subscribe
- Mute
- Printer Friendly Page
- Mark as New
- Bookmark
- Subscribe
- Mute
- Subscribe to RSS Feed
- Permalink
- Report Inappropriate Content
Line Chart with Label inside the plot area
Hi, I need to create a line chart with label inside (or on the left) in the plot area (please see attached picture).
1) How to disable the Y-axis number?
2) How to Label the line?
Regards
Benjamin See
- Tags:
- new_to_qlikview
Accepted Solutions
- Mark as New
- Bookmark
- Subscribe
- Mute
- Subscribe to RSS Feed
- Permalink
- Report Inappropriate Content
That looks like a job for a Mini Chart.
Create a chart of type Straight table with the dimension you want. Then create an Expression for the straight table. On the expression tab select Mini Chart from the Display \ Representation drop down. Once that has been done a button will appear with the legend Mini Chart Settings. In here you can set a dimension do show your chart over and various other options.
Good luck!
Steve
- Mark as New
- Bookmark
- Subscribe
- Mute
- Subscribe to RSS Feed
- Permalink
- Report Inappropriate Content
Hi Benjamin,
if it is this what you want
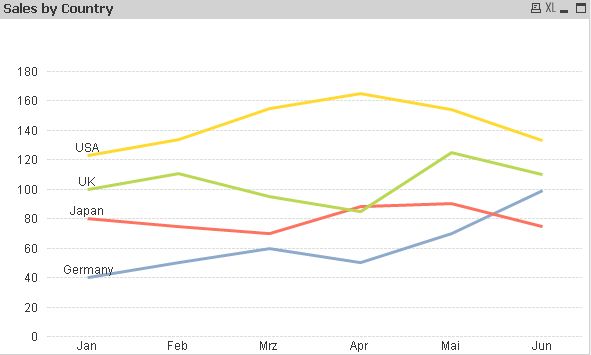
then wrap your expression into the dual function e.g. Dual(If(Month=Min(TOTAL Month), Country, ''), Sum(Sales))
Please check 'Values on Data Points' and you will get the above result.
Enjoy
Burkhard
- Mark as New
- Bookmark
- Subscribe
- Mute
- Subscribe to RSS Feed
- Permalink
- Report Inappropriate Content
I think what I need need is Mini Chart. Now testing on it. Thanks.
- Mark as New
- Bookmark
- Subscribe
- Mute
- Subscribe to RSS Feed
- Permalink
- Report Inappropriate Content
I try to put in 60 days (Date as Dimension) in Mini Chart, and I get below error message:
"Allocated Memory Exceed"
Is there any limitation of the Mini Chart? Currently I am using PE version.
Regards
Benjamin See
- Mark as New
- Bookmark
- Subscribe
- Mute
- Subscribe to RSS Feed
- Permalink
- Report Inappropriate Content
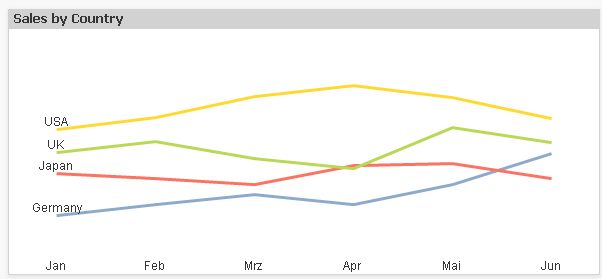
Sorry, Benjamin, I forgot to hide the axis. If you go to 'Axis' and mark the 'Hide Axis' check box this is the picture you'll get. Looks like mini charts...
Regards
Burkhard
- Mark as New
- Bookmark
- Subscribe
- Mute
- Subscribe to RSS Feed
- Permalink
- Report Inappropriate Content
Hi Benjamin - there is not a limit on dimension values that I am aware of. How many rows does your straight table have?
Allocated memory exceeded can often come from an over complicated expressions (perhaps you could post the expression here?) or issues in the data model - eg. tables that don't join to each other causing Cartesian products.
- Mark as New
- Bookmark
- Subscribe
- Mute
- Subscribe to RSS Feed
- Permalink
- Report Inappropriate Content
Hi,
Yes, it was Mini Chart that I looking for.
Thanks. I got all I need.
- Mark as New
- Bookmark
- Subscribe
- Mute
- Subscribe to RSS Feed
- Permalink
- Report Inappropriate Content
Hi, thanks. I put the dimension field in the wrong place. It all working fine now. 