Unlock a world of possibilities! Login now and discover the exclusive benefits awaiting you.
- Qlik Community
- :
- All Forums
- :
- QlikView App Dev
- :
- Line Graph Help
- Subscribe to RSS Feed
- Mark Topic as New
- Mark Topic as Read
- Float this Topic for Current User
- Bookmark
- Subscribe
- Mute
- Printer Friendly Page
- Mark as New
- Bookmark
- Subscribe
- Mute
- Subscribe to RSS Feed
- Permalink
- Report Inappropriate Content
Line Graph Help
Hey guys,
I have a line graph that I am trying to show items produced per month. Currently it only shows Jan through September because we haven't collected any data for the rest of the year (Oct, Nov, Dec). I was curious to see how I can get those months to show up anyways with no data collected so far. Here is the current formula I am using to show the total per month.
Sum({$<Program_Dash={'Mechanical Inspection'}, Status_Dash={'Completed'}, Year = {"$(=Year(FirstWorkDate(ConvertToLocalTime(Date(now()), 'GMT-05:00'),1,$(vHolidays))))"}>} Processed_Dash)
- Mark as New
- Bookmark
- Subscribe
- Mute
- Subscribe to RSS Feed
- Permalink
- Report Inappropriate Content
Try this,
Temp_Calendar_Range:
LOAD
Num(Min(Date_Hash)) as MinDate,
Num(Max(Date_Hash)) as MaxDate
FROM [lib://Data files/OB_Summary_Data.xlsx];
LET vStartDate=Peek('MinDate', 0, 'Temp_Calendar_Range');
LET vEndDate=Peek('MaxDate', 0, 'Temp_Calendar_Range');
Calendar:
LOAD * ,
Year(CalDate1) AS CalYear, // Standard Calendar Year
Month(CalDate1) AS CalMonth,// Standard Calendar Month
Date(CalDate1,'MMM') as CalMonthName, // Standard Calendar Month Name
'Q' &'-'& Ceil(Month(CalDate1)/3) as CalQuarter; // Standard Calendar Quarter
LOAD
Date($(vStartDate) + IterNo() - 1) as CalDate1
AUTOGENERATE (1)
WHILE $(vStartDate) + IterNo() - 1 <= $(vEndDate);
Regards,
Pratik
- Mark as New
- Bookmark
- Subscribe
- Mute
- Subscribe to RSS Feed
- Permalink
- Report Inappropriate Content
Alright, that script loaded, what do I use as my expression for the graph? I tried CalMonth and it just returned the sum of all data for Jan - Sept.
- Mark as New
- Bookmark
- Subscribe
- Mute
- Subscribe to RSS Feed
- Permalink
- Report Inappropriate Content
In the expression,
Sum({$<Program_Dash={'Mechanical Inspection'}, Status_Dash={'Completed'}>} Processed_Dash)
Uncheck the 'Suppress Zero Values' in the Presentation tab.
Regards,
Pratik
- Mark as New
- Bookmark
- Subscribe
- Mute
- Subscribe to RSS Feed
- Permalink
- Report Inappropriate Content
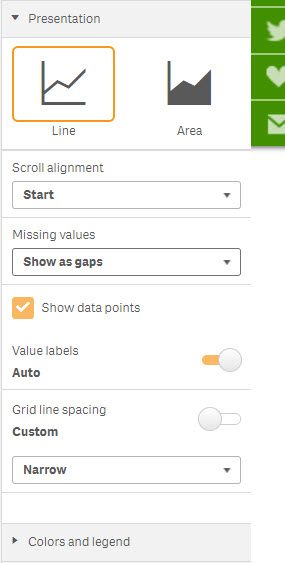
This is all I get under Presentation.
- Mark as New
- Bookmark
- Subscribe
- Mute
- Subscribe to RSS Feed
- Permalink
- Report Inappropriate Content
Sorry for the misunderstanding Josh.
I was suggesting this for QlikView.
For QlikSense, Go to Add-ons ---> Data Handling ---> Check Include Zero Values
Regards,
Pratik
- Mark as New
- Bookmark
- Subscribe
- Mute
- Subscribe to RSS Feed
- Permalink
- Report Inappropriate Content
For the Dimension am I still supposed to use Month?
- Mark as New
- Bookmark
- Subscribe
- Mute
- Subscribe to RSS Feed
- Permalink
- Report Inappropriate Content
Yes
- Mark as New
- Bookmark
- Subscribe
- Mute
- Subscribe to RSS Feed
- Permalink
- Report Inappropriate Content
Here is my app if you'd like to take a look.
- Mark as New
- Bookmark
- Subscribe
- Mute
- Subscribe to RSS Feed
- Permalink
- Report Inappropriate Content
As your data is only till Sept, it is generating months only till Sept and not showing Oct, Nov, Dec.
For this try,
vEndDate = Num(Date(Yearend(today()))); //instead of Peek('MaxDate', 0, 'Temp_Calendar_Range');
Regards,
Pratik
- Mark as New
- Bookmark
- Subscribe
- Mute
- Subscribe to RSS Feed
- Permalink
- Report Inappropriate Content
I tried this and still only shows through sept.