Unlock a world of possibilities! Login now and discover the exclusive benefits awaiting you.
- Qlik Community
- :
- All Forums
- :
- QlikView App Dev
- :
- Line chart axis changes
- Subscribe to RSS Feed
- Mark Topic as New
- Mark Topic as Read
- Float this Topic for Current User
- Bookmark
- Subscribe
- Mute
- Printer Friendly Page
- Mark as New
- Bookmark
- Subscribe
- Mute
- Subscribe to RSS Feed
- Permalink
- Report Inappropriate Content
Line chart axis changes
Hi I have line chart currently which shows Original Budget and Current Budget by month for a financial year, see the attached example.
Now I want to show a line chart with the combined totals for the year for Original and Current Budget, something like the attached example in the New file
I have tried making the Original and Current dimensions, but somehow it's just not putting them next to each other with a line between them as in the second example. What am I missing?
Accepted Solutions
- Mark as New
- Bookmark
- Subscribe
- Mute
- Subscribe to RSS Feed
- Permalink
- Report Inappropriate Content
- Mark as New
- Bookmark
- Subscribe
- Mute
- Subscribe to RSS Feed
- Permalink
- Report Inappropriate Content
Hi Andret,
Original and Current shouldn't be dimensions. The dimension you need will be Budget with two values 'Original' and 'Current'.
If that's what you meant to say and you've tried it already and it's not working then post your data and I'm sure a solution will be found.
Cheers
- Mark as New
- Bookmark
- Subscribe
- Mute
- Subscribe to RSS Feed
- Permalink
- Report Inappropriate Content
Example is attached. Note the example of how I need to see this in the new image file
- Mark as New
- Bookmark
- Subscribe
- Mute
- Subscribe to RSS Feed
- Permalink
- Report Inappropriate Content
Hi,
Please find attached file for solution.
Regards,
jagan.
- Mark as New
- Bookmark
- Subscribe
- Mute
- Subscribe to RSS Feed
- Permalink
- Report Inappropriate Content
Hi Andret,
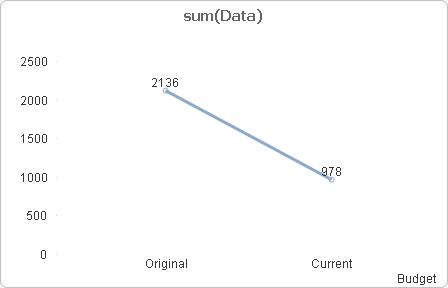
Having a Crosstable in your load script will make the chart easy to produce:
CTData:
CrossTable(Budget,Data)
LOAD * Resident Data;
This gives this straight table:
| Budget | sum(Data) |
|---|---|
| 3114 | |
| Original | 2136 |
| Current | 978 |
or a line chart:
- Mark as New
- Bookmark
- Subscribe
- Mute
- Subscribe to RSS Feed
- Permalink
- Report Inappropriate Content
Thanks for this. I have so much data manipulation at this stage so it's really confusing script wise, adding this will just over complicate it for me at this stage. I do this the solution is really great. I have used similar ways to get my data easier to work with. I think it works just as well probably as the other solution. Just for my specific needs this just gets too much to get the data correct for all possible graphs I have to produce.
Thanks a million though
- Mark as New
- Bookmark
- Subscribe
- Mute
- Subscribe to RSS Feed
- Permalink
- Report Inappropriate Content
Works perfectly for me with the data I have.
Thanks