Unlock a world of possibilities! Login now and discover the exclusive benefits awaiting you.
- Qlik Community
- :
- All Forums
- :
- QlikView App Dev
- :
- Line chart - % between years
- Subscribe to RSS Feed
- Mark Topic as New
- Mark Topic as Read
- Float this Topic for Current User
- Bookmark
- Subscribe
- Mute
- Printer Friendly Page
- Mark as New
- Bookmark
- Subscribe
- Mute
- Subscribe to RSS Feed
- Permalink
- Report Inappropriate Content
Line chart - % between years
Hi everyone.
Here's my problem : I want to know the percentage between all the years for one data.
In my pivot table, I have no problem, but when I try to put it in a line chart, there are some issues.
I have two dimensions : all the activities and the year. (in this order)
| Year | Activity | sum(Prices) | ||
|---|---|---|---|---|
| 2011 | Swimming pool | 1.000 | ||
| 2012 | Swimming pool | 1.100 | ||
| 2013 | Swimming pool | 1.000 | ||
| 2011 | Dojo | 2.000 | ||
| 2012 | Dojo | 2.200 | ||
| 2013 | Dojo | 2.420 |
So, I want that my line chart has 2 lines, the first one for the swimming pool, for which in 2012, it shows +10%" and in 2013 -"10%" and for the dojo 2012:'+10%' and 2013 "+10%".
I tried to create the following expression : sum(Prices)/above(sum(Prices))-1, but it doesn't work.
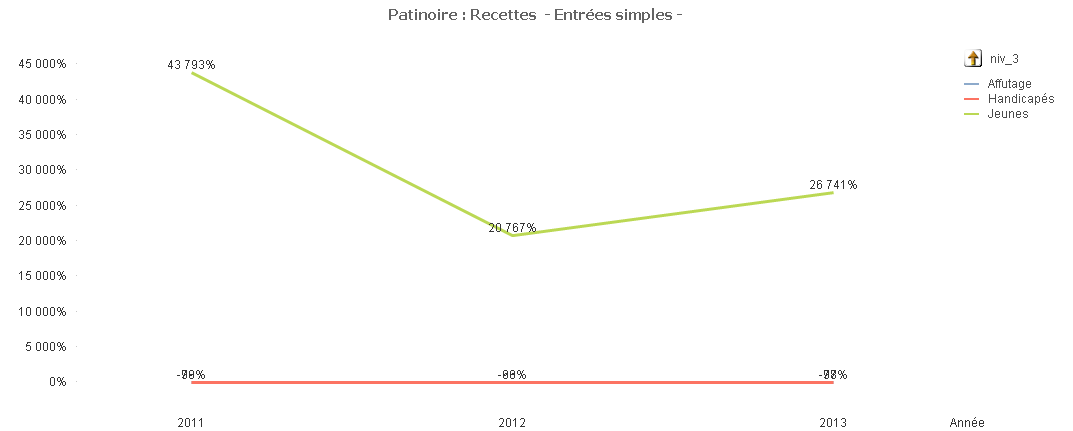
(niv_3 = activities)
But when I switch the dimensions ( Year - activity), it gave me the right numbers, except that the dimensions are inversed.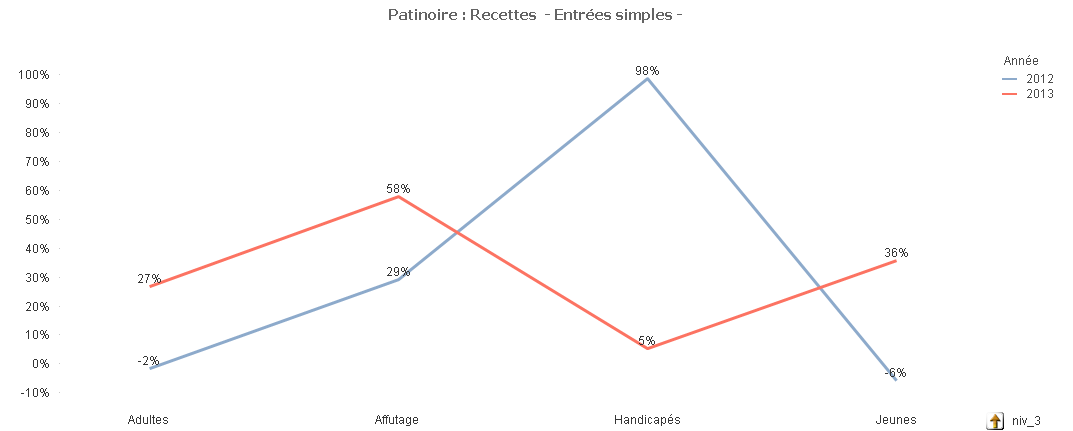
Can someone help me please ?
Thanks a lot !
- Tags:
- new_to_qlikview
- Mark as New
- Bookmark
- Subscribe
- Mute
- Subscribe to RSS Feed
- Permalink
- Report Inappropriate Content
Sorry to up it, but does someone can help me ? Or maybe had I bad explained my problem ?