Unlock a world of possibilities! Login now and discover the exclusive benefits awaiting you.
- Qlik Community
- :
- All Forums
- :
- QlikView App Dev
- :
- Line chart can have diffrent style of representati...
- Subscribe to RSS Feed
- Mark Topic as New
- Mark Topic as Read
- Float this Topic for Current User
- Bookmark
- Subscribe
- Mute
- Printer Friendly Page
- Mark as New
- Bookmark
- Subscribe
- Mute
- Subscribe to RSS Feed
- Permalink
- Report Inappropriate Content
Line chart can have diffrent style of representation..!!
hi all,
i am using line chart with two dimensions first one is week and other is calculated dimension and one expression.
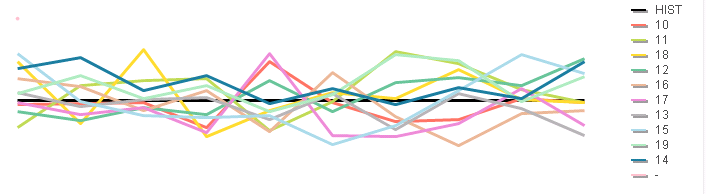
line chart has diffrent 10 to 15 lines based on calculated dimension,
Each line has diffrent color,but i need diffrent color with diffrent style for each line displayed.
- « Previous Replies
-
- 1
- 2
- Next Replies »
- Mark as New
- Bookmark
- Subscribe
- Mute
- Subscribe to RSS Feed
- Permalink
- Report Inappropriate Content
hi bill thanks for reply,
let me explain, that chart is default view of history and simulation . history has only one lineand others lines are of simulation, calculated based on different parameters,user can select those parameters. and if user select only one parameter then it will show one history and one simulation line and number of lines increases depends upon the selection of calculated simulation values by the user but the chart i have shown here it is default one in that all values of calculated simulation displayed.
- « Previous Replies
-
- 1
- 2
- Next Replies »