Unlock a world of possibilities! Login now and discover the exclusive benefits awaiting you.
- Qlik Community
- :
- All Forums
- :
- QlikView App Dev
- :
- Line chart expression
- Subscribe to RSS Feed
- Mark Topic as New
- Mark Topic as Read
- Float this Topic for Current User
- Bookmark
- Subscribe
- Mute
- Printer Friendly Page
- Mark as New
- Bookmark
- Subscribe
- Mute
- Subscribe to RSS Feed
- Permalink
- Report Inappropriate Content
Line chart expression
Hi all,
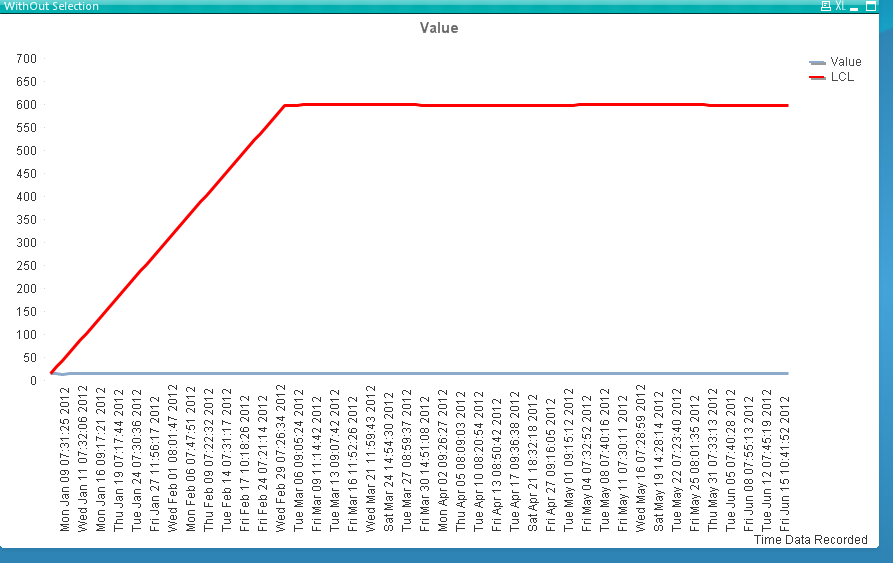
i'm trying below expression in Line Chart. I,m calculating the Cloverunit = A06129, Lens#=1, measure=Ave Lens Diameter(mm), PLDate = last 2 months sum of LCL.
In pivot table having another few more expressions that displays data from all the dates(Not restricted to last two months).
=Sum({1<[Clover Unit]={'A06129'}, Lens#={'1'},measure={'Ave Lens Diameter (mm)'},PLDate={">$(=Date(AddMonths(Max(PLDate),-2),'MMM DD YYYY'))"}>} LCL)
Now i'm getting line in chart for LCL for last two months , but that value line should display for entire data. Please find the attached screen shot.
Thanks in advance
Regards,
Venkat.
- « Previous Replies
-
- 1
- 2
- Next Replies »
Accepted Solutions
- Mark as New
- Bookmark
- Subscribe
- Mute
- Subscribe to RSS Feed
- Permalink
- Report Inappropriate Content
Hi,
Myself found the solution. Here is the attached app what i tried for.
Regards,
Venkat
- Mark as New
- Bookmark
- Subscribe
- Mute
- Subscribe to RSS Feed
- Permalink
- Report Inappropriate Content
try to change table to straight and use Acumulation in expression
- Mark as New
- Bookmark
- Subscribe
- Mute
- Subscribe to RSS Feed
- Permalink
- Report Inappropriate Content
Hi,
I'm sorry mistake instead of Line chart i typed pivot table.
Using the expression in line chart.
Thanks in advance.
Regards,
Venkat
- Mark as New
- Bookmark
- Subscribe
- Mute
- Subscribe to RSS Feed
- Permalink
- Report Inappropriate Content
can you post a sample file?
- Mark as New
- Bookmark
- Subscribe
- Mute
- Subscribe to RSS Feed
- Permalink
- Report Inappropriate Content
Hi,
Please find the atached app.
Thanks in advance.
- Mark as New
- Bookmark
- Subscribe
- Mute
- Subscribe to RSS Feed
- Permalink
- Report Inappropriate Content
fist thing is
i see that LCL is similiar to value, so last two monts LCL sum should be about 60*value:)
so chart on your screenshot is wrong
am i right?
- Mark as New
- Bookmark
- Subscribe
- Mute
- Subscribe to RSS Feed
- Permalink
- Report Inappropriate Content
I didn't get what you mean to say ?
Please explain some more briefly.
Thanks in advance
- Mark as New
- Bookmark
- Subscribe
- Mute
- Subscribe to RSS Feed
- Permalink
- Report Inappropriate Content
sum(value)
and
sum(LCL)
are almost equal right?
- Mark as New
- Bookmark
- Subscribe
- Mute
- Subscribe to RSS Feed
- Permalink
- Report Inappropriate Content
Value and LCL are not equal.
But their values will have slight difference i.e; most of the Value field is greater than LCL
What i'm trying to acheive is i'm calculating last 2 months sum(LCL) and that calculated result(i.e;sum(LCL)) should show for all months in line chart.
I hope you might understand now, please let me know if you don't got it. I'll will try to make clear in better way.
Thanks in advance.
- Mark as New
- Bookmark
- Subscribe
- Mute
- Subscribe to RSS Feed
- Permalink
- Report Inappropriate Content
i mean ALMOST EQUAL
this means that sum(LCL) of last two months will be much higher
so the linechart probably look more like:
right?
- « Previous Replies
-
- 1
- 2
- Next Replies »