Unlock a world of possibilities! Login now and discover the exclusive benefits awaiting you.
Announcements
April 13–15 - Dare to Unleash a New Professional You at Qlik Connect 2026: Register Now!
- Qlik Community
- :
- All Forums
- :
- QlikView App Dev
- :
- Line chart incorrectly displayed
Options
- Subscribe to RSS Feed
- Mark Topic as New
- Mark Topic as Read
- Float this Topic for Current User
- Bookmark
- Subscribe
- Mute
- Printer Friendly Page
Turn on suggestions
Auto-suggest helps you quickly narrow down your search results by suggesting possible matches as you type.
Showing results for
Not applicable
2015-02-13
10:26 AM
- Mark as New
- Bookmark
- Subscribe
- Mute
- Subscribe to RSS Feed
- Permalink
- Report Inappropriate Content
Line chart incorrectly displayed
I have an issue with a line chart not displaying correctly when a Static Min is configured for the Y axis.
Please refer to the screenshot below or the attached qvw. There is a noticeable dent in the line on the right chart which has a static min set.
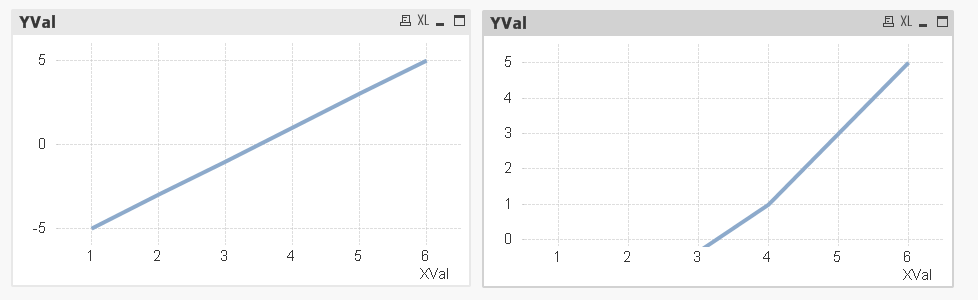
I'd appreciate any clue on what might be causing this.
Thanks,
Zoltan
360 Views
1 Reply
Specialist
2015-02-13
10:30 AM
- Mark as New
- Bookmark
- Subscribe
- Mute
- Subscribe to RSS Feed
- Permalink
- Report Inappropriate Content
If I set it to -1 it straightens out.
I think this has to do with your scale
Whole number on the Y and a decimal on the min axes.
If I set the y axis to 1 decimal the dent stays.
If this is a bug you could report it to support.
315 Views